Dec 01

New EPSG codes published for Wisconsin

On November 25, 2015, EPSG codes were published for Wisconsin’s county-specific coordinate systems. This is the first time that the Wisconsin Coordinate Reference System (WISCRS) will have registered EPSG codes. The codes reference the NAD83 (2011) definition of WISCRS, which was required by EPSG. The codes can be found at http://www.epsg-registry.org/.

What does this mean for Wisconsin GIS users?

Picture1
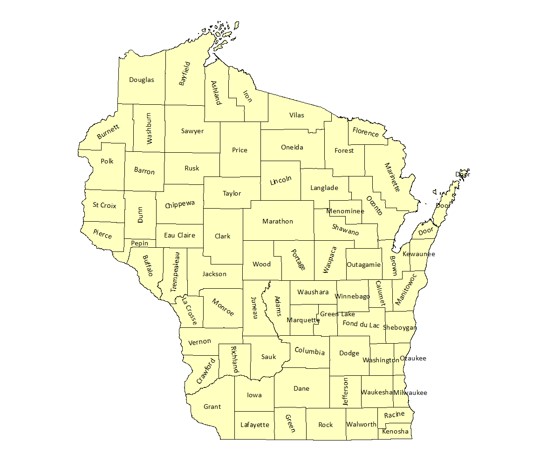
The EPSG codes are used by geospatial software companies to name and reference coordinate systems in a standardized way across the industry. Now we can request that new software releases include each of the WISCRS definitions so that county datasets are recognized and available in the projection drop down lists. This means that you won’t need to load custom parameters from a .prj.

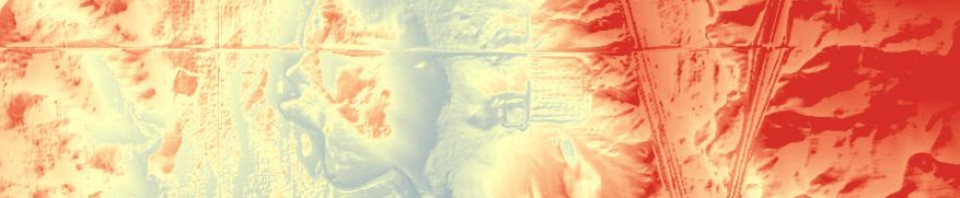
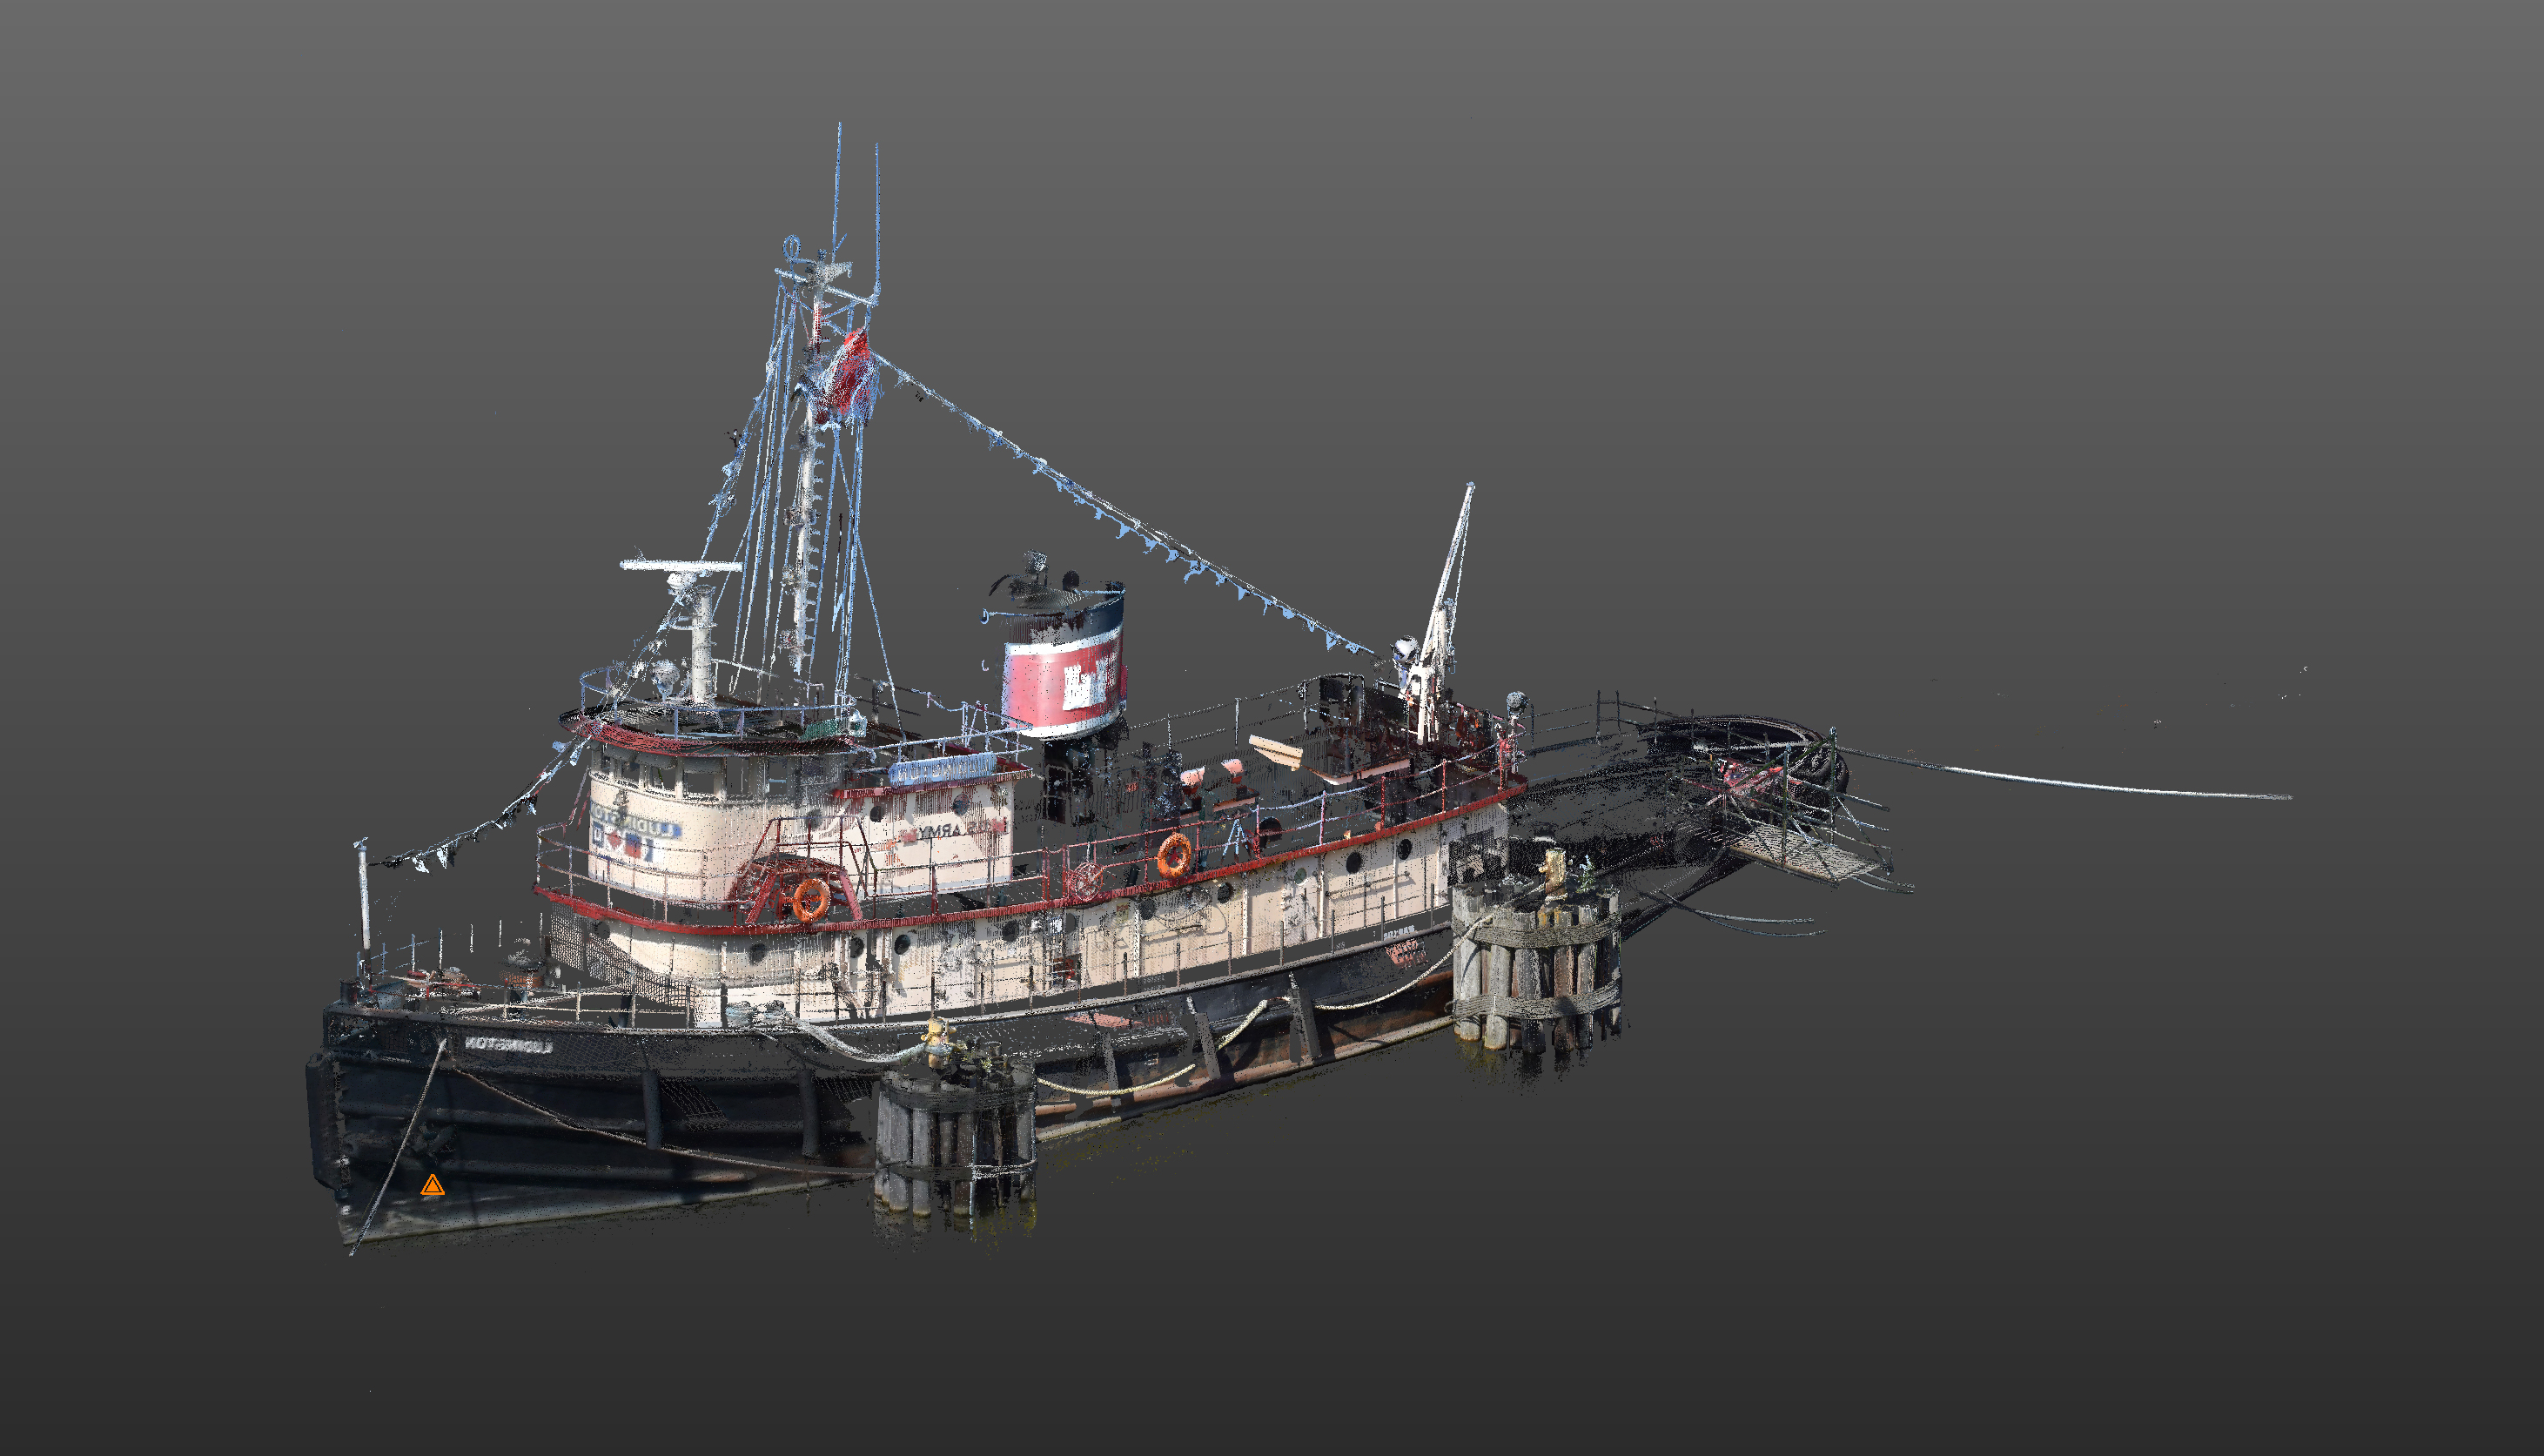
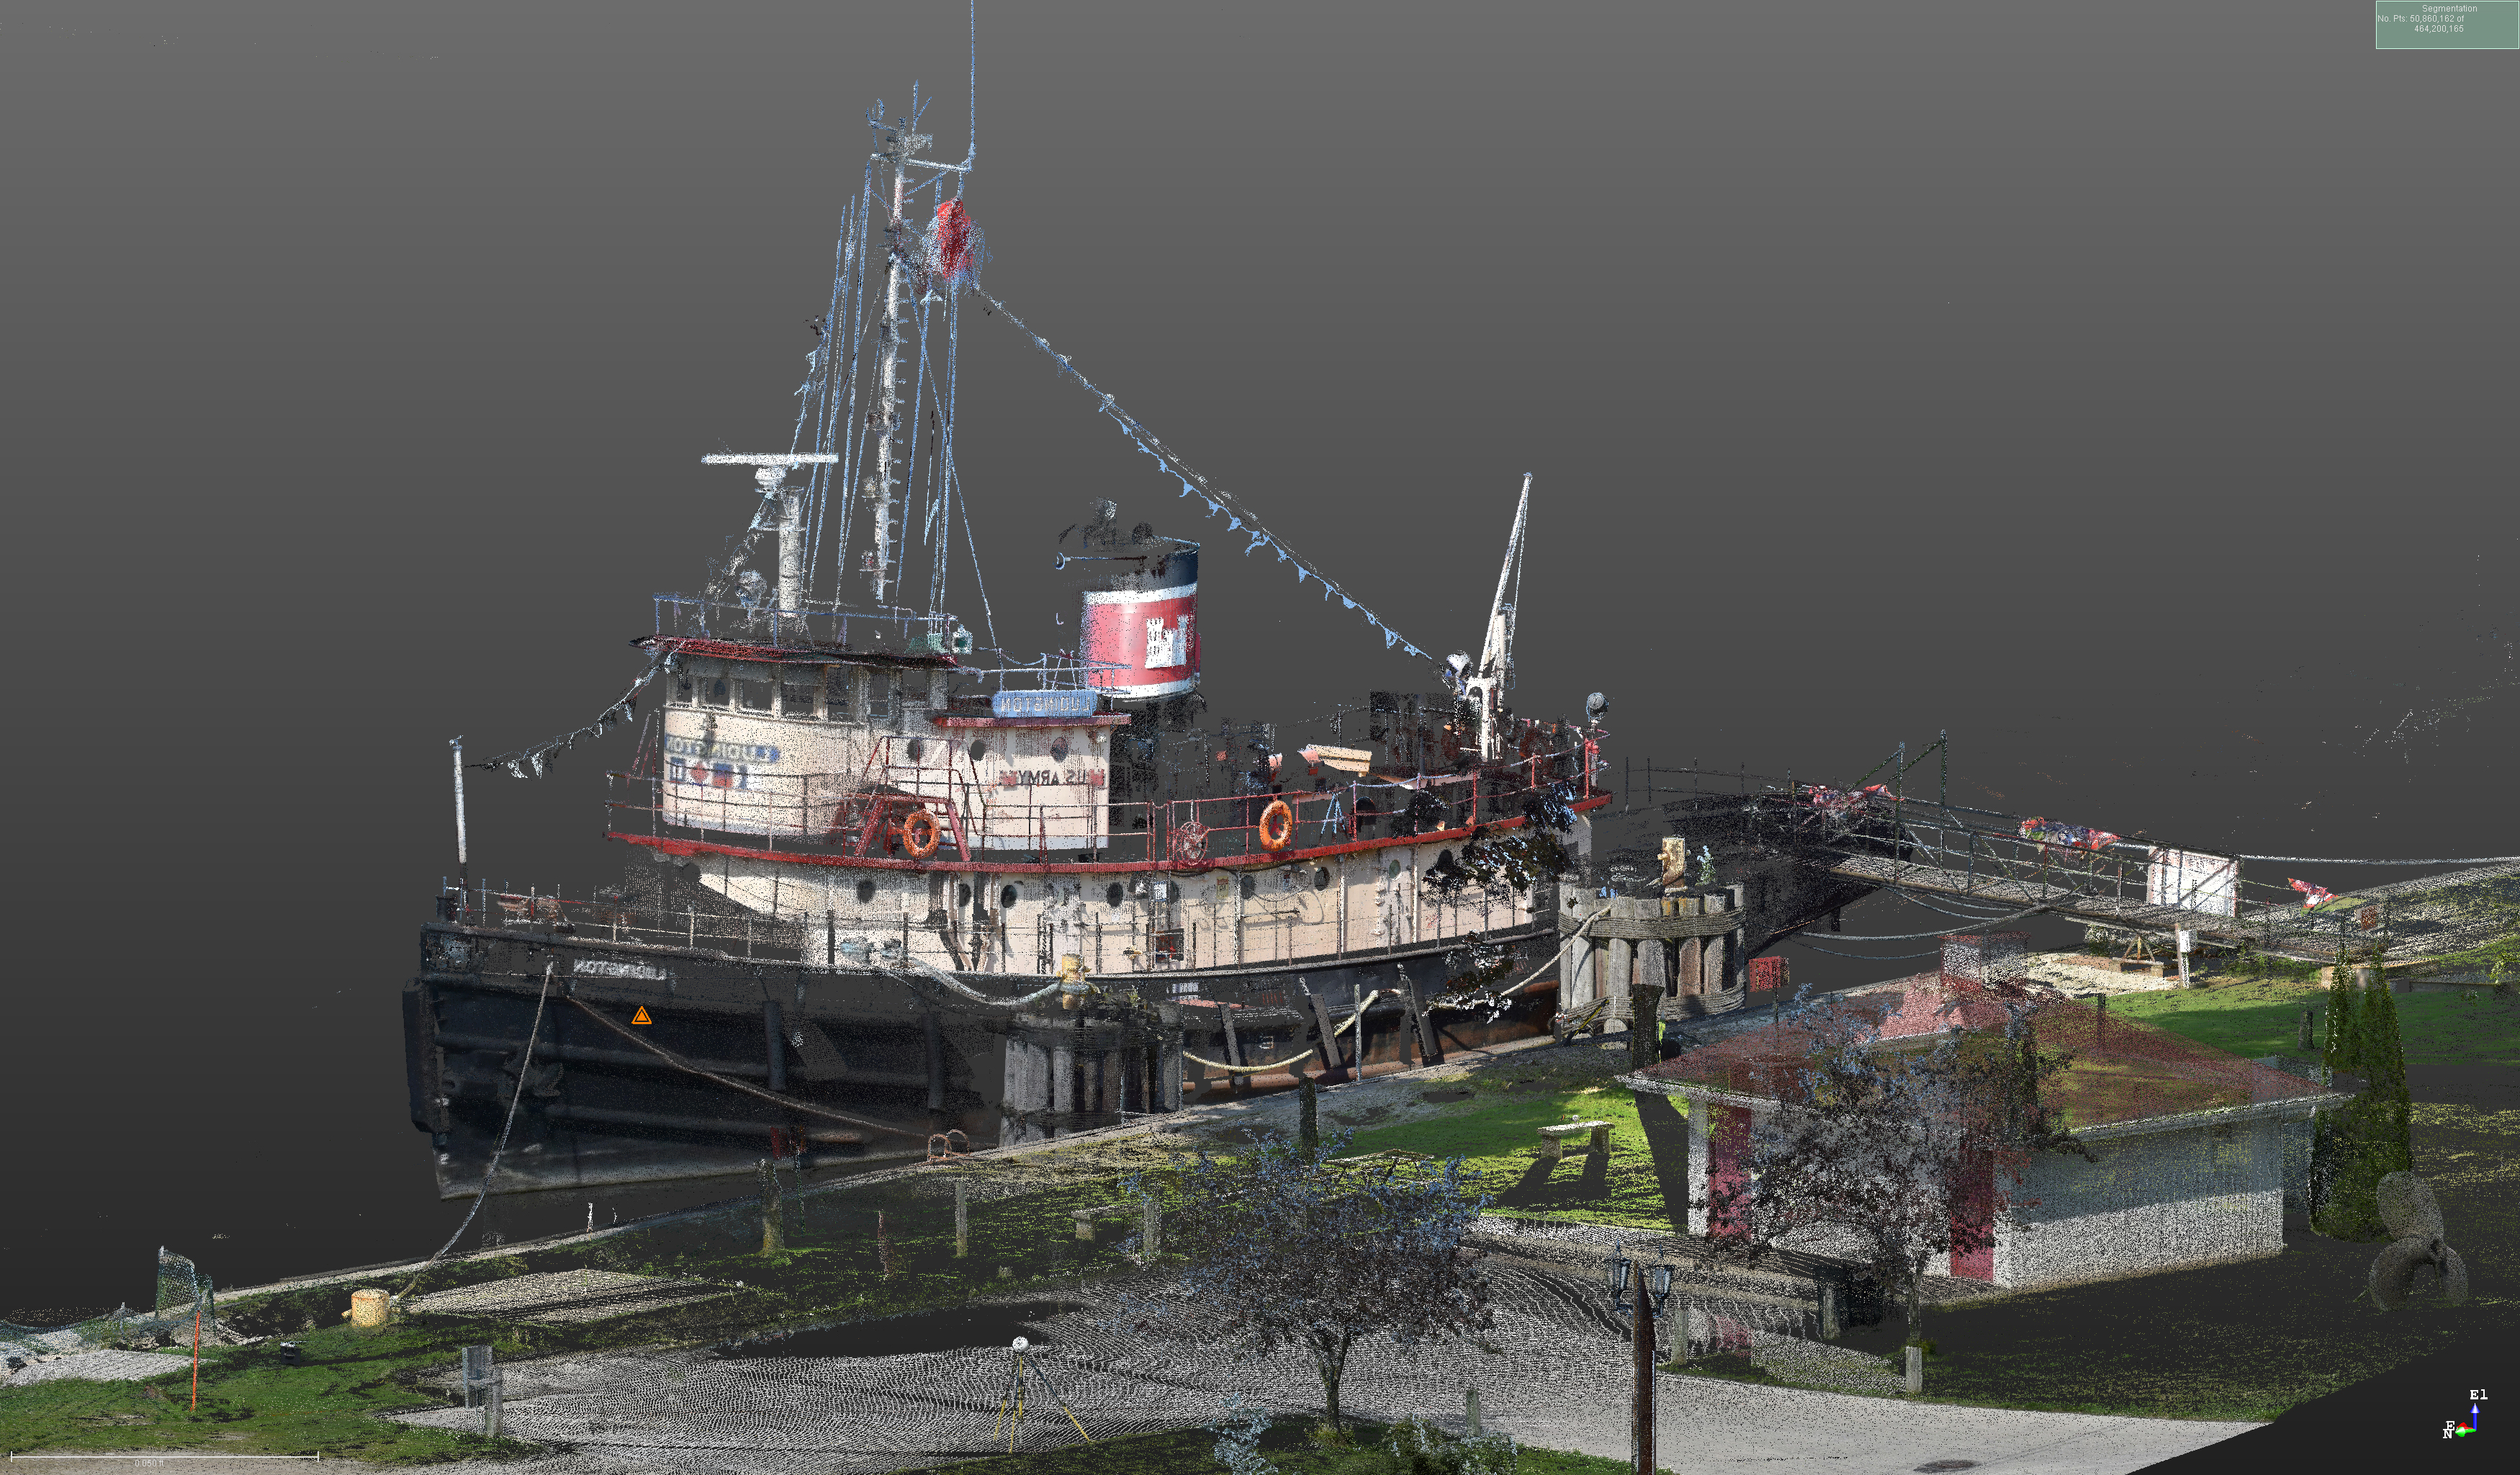
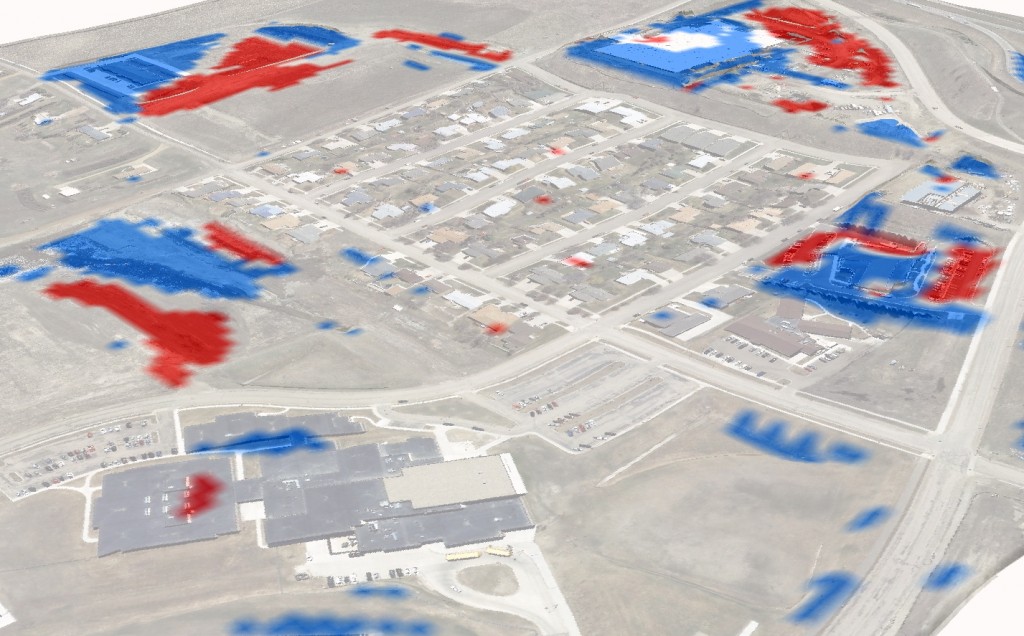
There is an added benefit for lidar datasets being produced in Wisconsin as part of 3DEP. The USGS requires the EPSG codes for data to be accepted by their 3DEP program. Now the USGS will accept datasets in WISCRS, in addition to UTM and State Plane coordinates. And that means more efficient publishing of Wisconsin lidar data in the National Map.

For more information about the newest release, visit:  http://www.epsg.org/WhatIsNew


Nov 10

HD Laser Scan of WWII Era Tug Boat in Kewaunee

As part of a survey of the Kewaunee Harbor on Lake Michigan, Ayres Associates captured a detailed Laser Scan of the Harbor Park and surrounding area. The centerpiece of the Park is the Tug Ludington, which participated in the D-Day Invasion of Normandy and had an important role in Great Lakes.  Formerly known as LT-4 by its US Army designation, and as the Major Wilbur Fr. Browder, it is listed on the National Register of Historic Places.  Read more about the Ludington here:  https://en.wikipedia.org/wiki/Tug_Ludington

boat


boat2


boat scan

HD laser scanning is among the many services available at Ayres Associates. Our extensive history of supporting diverse engineering applications allows us to approach each project as a unique mission with an individualized solution. Because Ayres Associates incorporates the experience of many disciplines in the implementation of the HD scanning technology, your project and budget can take advantage of the innovative solutions that we collectively offer.

HD scanning supports a wide range of applications for as-built survey and asset inventory:

  • Transportation designIMG_20141220_113710_620

  • Bridge and overhead obstruction clearance

  • Substations and utility infrastructure

  • Industrial facility maintenance

  • Change detection (load stress and settling)

  • Americans With Disabilities Act (ADA) compliance

  • Analysis of discontinuities


Oct 28

Cutting Culverts into Lidar DEM’s

WausauClassified frontLidar has become an important tool for management of water resources and for designing mitigation efforts for localized flood events.  While regional issues have driven topographic mapping efforts for counties, watersheds, and floodplains, the high accuracy and high definition Lidar surface models are now being applied to micro-drainage solutions.  However, the lack of culvert information with these surface models can present an issue for proper modeling of drainage patterns.

Incorporating culverts into a surface model is a simple process and can support important local and regional initiatives including:

Town of Woodville culvert_2530

  • Erosion Vulnerability Assessment for Agricultural Lands

  • Point, and Non-point Pollution Control

  • Stormwater Runoff and Retention


Problem: The bare earth Digital Elevation Models (DEM) prepared for the typical Lidar project do not incorporate culvert drainage into the surface models.  While thorough bare earth editing and hydro-reinforcement will accurately model natural flow patterns, there remain roadblocks to the drainage patterns where they intersect roads and driveways.  Here’s an example from Fond du Lac County, WI that shows the dam-effect of a road:

Area 1 Before

Solution: To maintain continuity of drainage across these unnatural barriers, culverts can be manually inserted to “cut the DEM” to facilitate flow lines.  The following image shows the manually placed culvert line.  In this case, the culverts were digitized from high resolution aerial imagery and draped to a 3D surface:

Area 1 After with Culvert LineArea 1 After

The Process: There are a number of approaches to cutting culverts, but the process starts with digitizing the culverts. It is difficult to identify culverts from the Lidar point density acquired for your typical topographic mapping project.  We recommend that these be collected from alternative sources.  For example, a surveyor can capture GPS data on culverts in the field.  More economical approaches may include extracting culverts using photogrammetric stereo-compilation or heads-up digitizing from aerial photography.  Lidar-grammetry techniques (compiling from intensity models) may be an option when high density Lidar is available.


FondDuLac_Classified
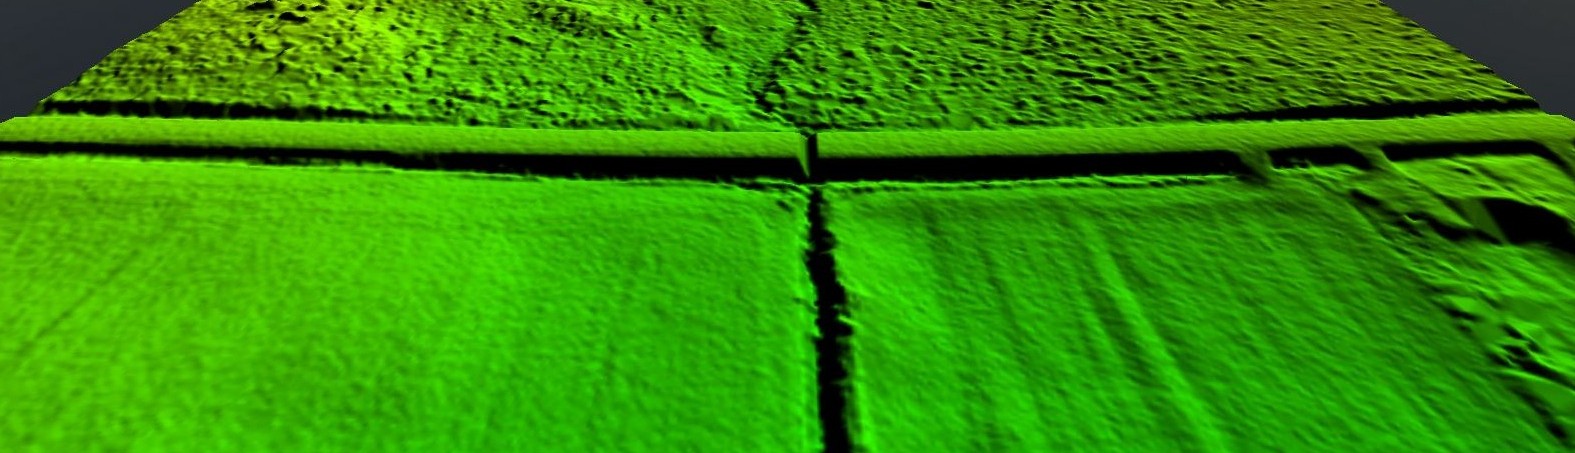
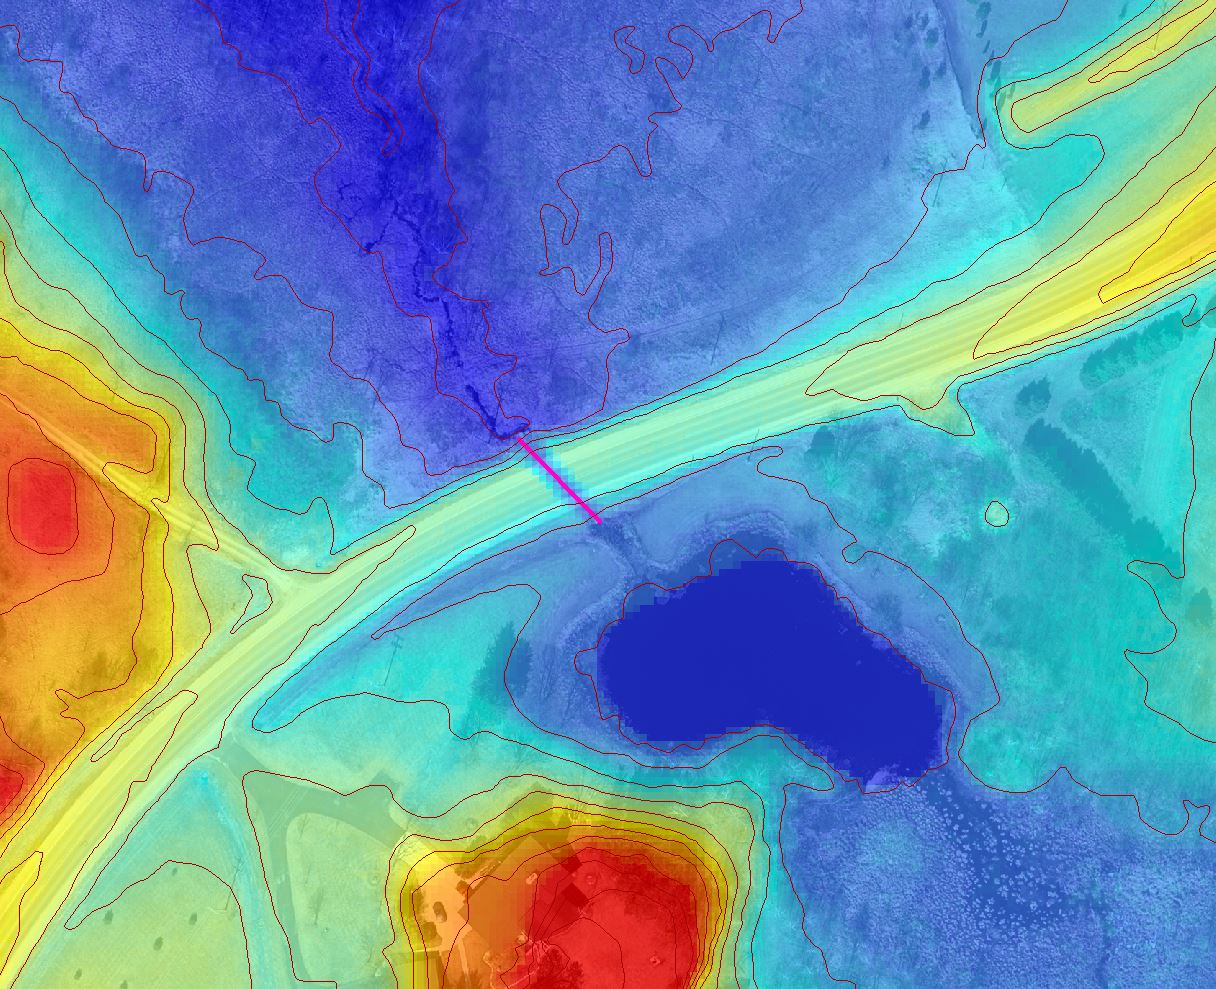
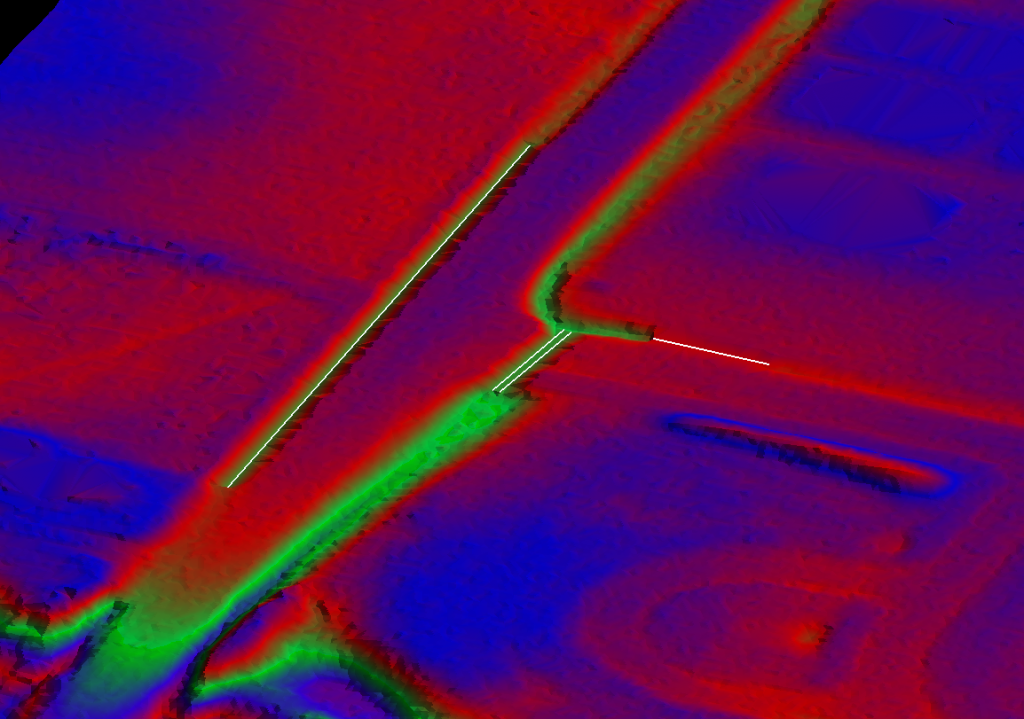
The digitized culvert lines need to be converted to a 3D breakline and incorporated into the bare earth surface data. We then remove the bare earth data from above and in proximity to the breakline using a buffer.

cut demWe can choose the buffer distance based on local conditions, client preferences, and point density.  For example, we may choose to use a 1-ft buffer when working with high density Lidar (< 0.7 ppsm) or 5-ft buffer with typical county-wide Lidar specifications.  A new DEM is produced that incorporates the breakline and filtered bare earth points.


Oct 07

Topographic Change Detection Models from LiDAR

A16-orthochange

Using multiple LiDAR surface models for detecting and monitoring change in topography over time.

 by Mike Seidel (Geospatial Services Technician) and Jason Krueger (Project Manager)

Local government entities are building new applications for Lidar that go far beyond the typical stormwater and floodplain applications. For example, we have written several articles on this blog site about vegetation and building extraction from Lidar.  This article will focus on the application of Topographic Change Detection Models where the data users have access to multiple Lidar datasets.

bism-ctrs-aWith the recent advancements of sensors and the availability of economical software suites, the costs for the investment in Lidar have dramatically fallen.  Counties and municipalities are now budgeting for topographic mapping updates or replacement every few years.  This has given rise to the feasibility of systematic change detection monitoring over extended periods of time and facilitates proactive responses to developing trends.

Applications

dem2013Change detection models allow the data users to quantify and qualify areas impacted by excavations, new construction, erosion, and even shifting river deposits.  It provides clear signs of growing stormwater drainage issues in new developments and evidence for zoning and building compliance.

The Process

Topographic change detection requires suface data from at least two different dates. The most common form of topographic data for GIS software is the Digital Elevation Model or DEM. Other sources of topographic data (such as a TINs) can also be used. 

First and foremost the surfaces must be registered to the same coordinate system. It is very important that the data is horizontally and vertically checked for accuracy as inaccurate data will skew the results of the change detection. Once data quality is ensured the difference calculation can be run. It is also recommended that the GRID cell size is consistent between the two datasets, but not absolutely necessary.

GIS Processing

To perform a change detection across surfaces in ArcGIS the Spatial Analyst extension is needed. Both grids are loaded into the software and a raster calculation is performed where one grid is subtracted from the other on a pixel by pixel basis. This process varies is duration based on the size and resolution of the data sets

For the purpose of demonstration, we took Lidar data from two separate missions that we completed for the Bismarck-Mandan area of North Dakota.  In this exercise we subtracted a 2009 DEM surface from a 2013 DEM surface of the same project extents. The 2009 data had a spatial resolution of 5m, while the 2013 data had a spatial resolution of 1m. The resultant data set is produced in the highest common resolution, which is this case was 5m.

 2009 Orthoimagery

A9-ortho2009change

2013 Orthoimagery

A10-ortho2013change

Processed Topographic Change Detection Model (2013-2009)

A12-orthochange

The Products

What results from this analysis is a “difference grid” that displays areas where elevations have changed. This dataset can then be run through additional steps to derive supplementary products such as contours of change or areas of change delineated by polygon. The supplementary products are particularly useful when overlaid with the difference grid to highlight area of extreme change. The resultant grid can also be used for quantitative analysis including volumetric calculations and the like, or qualitatively in geovisualiztion software where layers such as ortho imagery can be draped on the 3D surface to get a realistic view of topographic changes.

The outputs from this example include raster and vector products.  The Topographic Change Detection Model is a raster layer indicating amount of change.  This is generally prepared as an Esri GRID product.  Additionally, we delineate areas of change with vector polygons- this can reflect customized minimum size and vertical change thresholds.   It can also be output to “contours of change” by pre-determined intervals.

Topographic Change Detection Model and Contours of Change (2013-2009)

A19-orthochange

A23-orthochange

These data layers created from the Bismarck-Mandan example can now be efficiently and easily ingested into common GIS and CAD-based platforms for use by engineers, planners, and GIS specialists.

Sep 01

Remote Sensing to ID Ash Trees in Urban Forest near Chicago, Illinois

TP_leaf-on_IR2

Multispectral Imagery, Aerial LiDAR, and Ground Truthing Provide a Full Picture of an Urban Canopy

By Jason Krueger, Ayres Associates; Jason Carlson, Applied Ecological Services; and Dr. Fugui Wang, Applied Ecological Services

The greater Chicago region has been deeply affected by the Emerald Ash Borer (EAB) – an invasive species that has done considerable damage to the urban forest canopy. Targeting ash trees, a common and aesthetically popular part of suburban terrace landscapes, EAB has required a swift and costly response by many municipalities.

EABpennysixedA recent survey of tree species by the Village of Tinley Park has revealed that most of its 11,000 ash trees within public property had been infested by the invasive beetle. The results are devastating – much of the urban forest canopy was already dying when the Village made the difficult decision to remove nearly 10,000 susceptible trees within those public areas. Here’s a link to an article on the Village’s website which details their efforts to remove and replace ash trees within public areas: http://www.tinleypark.org/index.aspx?nid=648


Although Tinley Park and other communities are taking an aggressive approach to combat this beetle, their efforts are focused on the public spaces- particularly on road right-of-ways. However, many susceptible or dead ash trees remain on private lands where they are no less a problem. These dead and dying trees still have significant impacts on municipalities and pose potential safety hazards for homeowners. A contraction of urban forest may impact stormwater runoff- causing localized flooding and erosion. Loss of tree canopy may also lead to reduction in air quality and higher cooling costs in the summer. Dead and stressed trees can also pose threats when they lose large limbs or topple.

To help communities prepare for these impacts, Ayres Associates has been working closely with Applied Ecological Services (AES), of Broadhead, WI to develop methodologies for mapping urban forests and identifying ash trees (genus fraxinus). We have been focusing our efforts on the Village of Tinley Park, Illinois where we’ve collected an abundance of geospatial data over the past 5 years. Tinley Park, as part of the GIS Consortium (www.gisconsortium.org), has received high density aerial LiDAR and multiple aerial imagery products from Ayres Associates to support a robust GIS platform, supporting a wide range of municipal services. The impacts of EAB and the availability of geospatial data made the Village an ideal target for multiple related R&D efforts.

Tinley_crowns3Our previous R&D initiatives at Tinley Park have focused on tree canopy extraction and detecting affected trees. Ayres and AES are taking this previous work a step further by utilizing geospatial data for identifying tree species, with primary focus on the ash tree group classification.


Multiple Data Sources

This effort used strategically timed multi-spectral ortho photography, LiDAR and existing field derived tree inventory data to map and characterize tree canopy extents for Tinley Park. Two dates of ortho photos were used: 1) a spring-June 2013 and 2) fall-October 2014. In addition existing LiDAR point cloud data were used to derive feature heights and 2013 GPS tree inventory data were used to train the classification as well as validate accuracy of results.


Summary of available data sources:

• 4-band aerial imagery, 3” GSD, collected with an DMCII camera in March 2011.

• 4-band aerial imagery, 3” GSD, collected with an UltraCAM camera in March 2013.

• 4-band aerial imagery, 5.5” GSD, collected with an RCD30 camera in June 2013.

• 4-band aerial imagery, 5.5” GSD, collected with an RCD30 camera in October 2014.

• Aerial Lidar, 20 points per square meter, collected with a Trimble Harrier 68i in March 2014.

• Street tree inventory (2013), geodatabase, provided by Village of Tinley Park.

Zoomed_Out_Ortho_and_Trees

Orthoimagery with “high vegetation” Lidar classification


lidar2Lidar Point Cloud (20 pts/square meter)


tinley_dsm

Lidar – First Return DSM (20 pts/square meter)


EAB Street Tree Inventory Provided by the Village of Tinley Park


dead_trees1

Four-band, Leaf-on Orthos – Showing Dead Trees on Private Land vs. Street Tree Inventory


Classification

The classification focused on mapping tree canopy extents as well as characterization of dominant tree species groups: ash, honey locust, linden, maple, callery pear and oak. All other species were aggregated into a minor/other class. The canopy classification utilized a state-of-the-art segmentation process capable of producing polygons that represent real-world objects. This type of classification process has proven to be more effective, efficient and more accurate as compared to traditional pixel-based classification methods. This method really excels when applied to mapping distinct edges in combination with area that are spectrally heterogeneous.


TP_canopy_all_layers3

TP_canopy2

TP_canopy_ortho2

 Vectorized Canopies with Genus Attribution


The classification consisted of three key steps: 1) tree canopy delineation, 2) classification, and 3) accuracy assessment. The tree canopy was delineated based on characteristics of color variation (orthos) and feature heights (LiDAR). Canopy delineation was the result of a number of developed segmentation rules which utilized various algorithms to represent individual tree canopies rather than groups of trees. By identifying individual trees we were able to better characterize attributes of forest stand, such as numbers of trees and distribution of canopy extents.

TP_canopy_classes

Canopy Classes – Rasterized

The classification utilized all data layers mentioned above and a random forest algorithm. For each representative tree that was delineated in step 1, spectral/statistical values were compiled and utilized in the classification of tree canopy types.

Accuracy Assessment

For the accuracy assessment, 514 of 1277 surveyed trees were used as independent validation data set. The accuracy assessment shows that the producer and user accuracy of the ash tree classification were 60% and 80% accurate. The producer’s accuracy refers to the probability that a species of trees surveyed on the ground is classified as such. This value represents how well reference pixels of the ground cover type are classified. The user’s accuracy refers to the probability that a certain species of tree labeled on the map actually represents that category on the ground. User’s accuracy corresponds to error of commission, and producer’s accuracy corresponds to error of omission.

Accuracy_assessment

In addition, the classification procedures resulted in high accuracy for maple and honey locust species. As expected, the producer accuracies remained relatively low the other species not the focus of this mapping effort. Additional steps of class aggregation and/or modified timing of imagery mission may be necessary to achieve greater accuracy levels for the other, non-ash tree groups.

TinleyTreesDRAFT01

Summary

While performing street tree inventory and diagnostics may be effectively accomplished in the field, it may not be an efficient approach for a systematic survey of forest preserves, private property, or even an entire community. This is where geospatial data and remote sensing can be used to greater effect to aid in broader urban forest management.


Aug 02

High Density Lidar for Illinois Municipalities

Communities in northeastern Illinois incorporate high density aerial Lidar into everyday municipal engineering applications.  The rich data derived from these point clouds are being used for capital improvement projects, stormwater management, urban forestry, and planning.  Collaboration between municipalities allow smaller and mid-sized communities to economically implement this technology.

Micro-Drainage Analysis

The higher definition surfaces derived from Lidar is providing engineers and stormwater planners with more information to address overland flow issues in residential areas.

OverlandFlow1

The orange areas depicted above are representative of inundation areas defined using 2-ft interval contours obtained from a county.  The green lines are depression contours from a 1-ft contour Lidar data set derived from a high density point cloud (20 points per square meter).  While the 2-ft contour data may be useful for large-area, systematic analysis, the higher density data that these communities are acquiring are supporting micro-drainage analysis.


2D and 3D Feature Extraction from High Density Lidar

Lidar missions in this urban environment are designed to account for specific site conditions and maximize the potential for serving a broader range of services.  In order to support 1-ft interval contours and 3D feature extraction, Ayres Associates starts with analyzing appropriate Lidar point densities needed for each project along with swath orientation and overlap.

DesPlaines2

Lidar_compLidar is providing an alternative approach to compiling planimetric mapping, including impervious surfaces.  Using software designed to permit 3D compilation, the new mapping process replicates traditional photogrammetric methods.  The point clouds are capable of supporting 1″ = 50′ map scale for common GIS base mapping in 2D or 3D.

With the increasingly restrictive airspace around O’Hare International Airport, Ayres Associates has responded by adjusting our strategies to operate in this environment.  Because we can acquire Lidar in the evening hours, FAA and air traffic controllers have been much more accommodating towards our flight crews.  Additionally, the late night flights have provided an extra benefit by reducing the amount of auto traffic on major thoroughfares and highways- which helps to expose the bare earth for better surface modeling.

lidar1

RemovedDecks_After


Jul 15

Ayres stays current with national standards for Wisconsin mapping projects


New ASPRS standards adopted for 3DEP and other geospatial programs has impacts in Wisconsin; procedures already in place for ongoing WROC projects.

0689_001Our Aerial Mapping Group spent some time in early 2015 to prepare for changing standards in LiDAR and orthoimagery. In November of 2014, the American Society for Photogrammetry and Remote Sensing (ASPRS) adopted a brand new set of standards for geospatial data. This is the first attempt by ASPRS to set comprehensive standards for horizontal and vertical datasets generated from various technologies, primarily aerial imagery and LiDAR.


It has been important for our project managers and technical staff to be prepared for these changes. We flew and are currently processing 43 counties of orthoimagery and 13 countywide LiDAR datasets as part of the Wisconsin Regional Orthophotography Consortium (WROC). That’s a lot of data that needs to be processed to contractual specifications, which incorporates new standards.

IMG_20150311_104310579_HDR

The USGS awarded 3D Elevation Program (3DEP) grants to help fund a number of counties in Wisconsin to collect and process LiDAR in 2015. The USGS adopted the ASPRS accuracy standards for LiDAR data, and incorporated these standards into its Quality Level 2 (QL2) definition. Many of the LiDAR projects funded by 3DEP are required to meet the USGS QL2 definition. More 3DEP grants are anticipated for Wisconsin QL2 LiDAR projects in 2016.

Our geospatial technicians have processed more than 40 counties of LiDAR in Wisconsin that have met FEMA and/or USGS standards. Our team is dedicated to staying current with the new standards to ensure our projects continue to meet industry specifications.

IMG_20150428_144208294

Jul 08

HD Laser Scanning to Support Broad Services at Ayres

HD Scanning_subst

HD laser scanning is among the many services available at Ayres Associates. Our extensive history of supporting diverse engineering applications allows us to approach each project as a unique mission with an individualized solution. Because Ayres Associates incorporates the experience of many disciplines in the implementation of the HD scanning technology, your project and budget can take advantage of the innovative solutions that we collectively offer.

HD scanning supports a wide range of applications for as-built survey and asset inventory:

  • Transportation designIMG_20141220_113710_620

  • Bridge and overhead obstruction clearance

  • Substations and utility infrastructure

  • Industrial facility maintenance

  • Change detection (load stress and settling)

  • Americans With Disabilities Act (ADA) compliance

  • Analysis of discontinuities


Transportation

10The ability to quickly capture detailed information from HD laser scanners makes this an important tool for surveying and analyzing transportation infrastructure. The long-range capacity of laser systems set up at strategic vantage points enables a surveyor to effectively record precise Kewaunee Leica P-20 (8)measurements of hard-to-reach locations.

HD laser scanning is being effectively and efficiently used for generating asset inventories, transportation design drawings, and quality control studies of as-built construction.

points

For bridge surveys, HD Laser Scanners provide an efficient approach to performing vertical clearance measurements and conformance of as-built conditions to design criteria.  Vertical clearance surveys are critical to study and mitigate overheight collisions on bridges and overpasses- which can lead to costly damage to infrastructure and serious injury to motorists.


Substations and Electric Utilities

High Falls SubstationElectrical utility owners and designers use HD laser scanning for asset inventory on existing facilities, future expansion capacity, existing structural conditions and analysis, and as-built collection for maintenance. HD laser scan data can be integrated into existing aerial LiDAR data to create a more accurate and holistic data set.

Collection of data using HD laser scanning ATC_Rhinelandergreatly reduces the need for a facility to be taken out of service for data collection and allows entire sites to be captured safely and efficiently.


Industrial Facilities

industrialFeature extraction and modeling of assets for industrial building information modeling (BIM) is supported by precise, high-definition 3D laser scanning. These compact systems can be operated in confined spaces and from multiple viewing perspectives to capture high-definition details of mechanical, electric, and piping (MEP) infrastructure.

mmsd3D models developed from the laser scans are being used by mechanical and electrical engineers to perform space and load bearing capacity analysis for expansion.


Architecture

harrison_building2The low-impact application of HD laser scanning mitigates safety and damage concerns as architects document the existing site conditions prior to restoration and rehabilitation projects. The highly detailed information captured by these systems also reduces costly site revisits and enables remote quantification of assets and features. The ability to measure crucial “one off” items on existing buildings for replication in the design process greatly increases the quality and accuracy of the end product. Architectural designers and MEP engineering staff have the ability to design in 3D and run clash detection for potential conflicts.


Jun 08

Illinois GIS Consortium: Value through Collaboration

bannerAn invitation to municipalities in the greater Chicago area to participate in this high accuracy aerial mapping program. With the completion of the 2015 GIS Consortium (GISC) flights and with production in full-swing, communities are already preparing their mapping budgets for 2016 and beyond.

GIS Consortium Members

GISC_logoThe GIS Consortium (GISC) is a group of local communities working together to develop cost-effective solutions for geographic information systems (GIS) and related mapping technologies.  The organization was formed in 1999 and consists of cities and villages in northeast Illinois that are challenging traditional forms of community-based information systems. Current members include:

Bensenville • Buffalo Grove • Carol Stream • Deerfield • Des Plaines • Elk Grove Village • Glen Ellyn • Glencoe • Glenview • Highland Park • La Grange • Lake Forest • Lincolnshire • Lincolnwood • Morton Grove • Mundelein • Norridge • Northbrook • Oak Brook • Oak Park • Park Ridge • Riverside • Rolling Meadows • Schiller Park • Skokie • Tinley Park • Wheeling • Winnetka • Woodridge

glenview

Through this organization, communities benefit from collaboration between public and private partners. It represents an extraordinary collection of professionals from many disciplines, working together to build economical mapping and information solutions for numerous municipal departments: Stormwater and Floodplain Management, Public Works, Engineering, Planning and Zoning, Information Technology, GIS, Parks and Forestry, and Public Safety. GISC5lakeshore

Access to Advanced Mapping Technology

CTA4The GIS Consortium has access to the latest mapping and surveying technology. This toolbox comes with the professionals that know how to use them economically. Whether doing a small site survey or community-wide mapping effort, the Consortium can support your project with:

  • andrews_tbolts_TP1Digital Aerial Photography

  • Aerial LiDAR & 1-ft interval contours

  • Impervious Surface Mapping

  • HD Scanning and Mobile LiDAR

  • Color Infrared Imagery

  • andrews_tbolts_TP2Survey and Monumentation

  • Geographic Information Systems (GIS)


An Invitation to Participate

On behalf of the GIS Consortium, I would like to invite you to join these communities in this program. Unit pricing based on volume of participation has translated to significant savings – discounts up 40% are being realized for individual communities. We offer the benefits of this cooperative effort to all communities in the area; formal membership in the Consortium is not required.

For more information visit: www.gisconsortium.org

And read about unique mapping applications at:

www.ayresgeospatial.com/category/gis-consortium/

Contact Information 

Jason Krueger, CP, GISP

Project Manager

Ayres Associates

608.443.1230

kruegerj@ayresassociates.com

TP_leaf-on_IR2

drainage-basin flood-damage

May 24

Semi-automated Building Extraction from Aerial Imagery

profile

A combination of traditional photogrammetric techniques and new software applications can now be used for semi-automated building extraction from high-resolution aerial imagery. This process enables a cost-effective alternative to manual building footprint compilation. Ayres Associates has developed workflows that support the creation of both simple 2D footprints and complex 3D buildings tailored to meet project needs and budget constraints.

SP_3in_Buildings

Image Correlation

The task of extracting buildings from high-resolution aerial imagery begins with a point cloud derived from stereo-imagery. This point cloud is generated through a process called Image Correlation, also known as Photo-Correlated Digital Surface Modeling, or Semi-Global Matching (SGM). The overall procedure of extracting building from the image-correlated point cloud uses a combination of traditional photogrammetric mapping principles and software designed for LiDAR processing.

SP_3in_PointCloud_Classified

Image correlation is not exactly a new process: Ayres Associates has been using auto-correlation processes to build orthoimagery surfaces for 15 years. As aerial imagery programs are trending toward higher resolution, and with the introduction of new software, such as Intergraph’s Semi-Global Matching (SGM), we are now capable of generating point clouds with much greater definition and higher accuracy. Through this methodology we are generating millions of points per stereo-model which are then edited in the same fashion as LiDAR. These point clouds are efficiently processed in software systems built for managing large LiDAR data sets, including the TerraSolid suite.

SP_Surface

Colorized Point Cloud

One unique advantage to using image correlated point clouds is the incorporation of RGB (and/or IR) values. The point cloud can be attributed with pixel values extracted from the aerial imagery- resulting is something that looks like a 3D photograph. This provides our specialists with an additional element for interpreting point clouds during the editing and classification process.

OP_6in_Half_PointCloud

OakPark_Every10th

Feature Extraction

Building extraction occurs after image point cloud processing and editing is completed. Feature extraction software with edge detection and modeling tools will generate vector polygons from the classified imagery point cloud. Our specialists write customized macros to account for project specifics to better inform the software and define outputs. Additionally, the software permits some degree of customization based on the project landcover, such as urban vs rural environments.


buildings3


The modeling software is capable of generating 2D building footprints and 3D complex rooflines. These can then be formatted to CAD based platforms or incorporated into a GIS world. Ayres has generated 3D buildings that have been ingested into Google Earth and Esri geodatabases.

2D Buildings

The image below shows 2D building extracted from 6” aerial imagery of Sun Prairie, WI.

SunPrairie3In2D


Extruded Buildings

The image below shows 2D building extracted from 6” aerial imagery and extruded to maximum building elevation.

SunPrairie3In3Db


3D Buildings

The image below shows 3D building extracted from 3” aerial imagery of Sun Prairie, WI.

SP_3in_3DBig1

3D Buildings to Google Earth

The image below shows 3D building imported into Google Earth. TP_metra

Capabilities and Limiting Factors

The software’s ability to automatically model buildings relies on several key elements of the input data. For example, the characteristics of the flight planning and image acquisition play a big role in the building output. These factors includes the camera system used, the native image resolution (ground sample distance), flight line overlap (sidelap), and frame overlap (forward lap). In some instances we are now planning imagery missions to better facilitate feature extraction.

Other limiting factors associated with landcover types can influence the automation process- especially tree canopy coverage. The automated extraction works best in areas with minimal overhanging trees. Generally, urban and agricultural environments are conducive to better automation.

Results from the automated process are not perfect, nor should they be deemed as accurate as those compiled by traditional, manual photogrammetric compilation. Manual edit at various stages throughout the process can introduce significant improvements to the end product. It is important to note that the degree of manual edit can be scaled according to project and budget needs.

Change Detection and Leveraging Existing Imagery

This approach may encourage more frequent updates of base mapping information to measure and document change in landscape. Since many of our clients have multiple imagery datasets going back over a decade, more opportunities for change detection analysis exist. Rapidly evolving hardware and software applications like this will enable new perspectives on semi-automated feature extraction and the role of 3D modeling in everyday GIS applications.

Picture1

May 12

Ayres Spatially Integrated Video System

Capture5xx

Our Spatially Integrated Video system provides street level information for a wide range of municipal and highway applications.  The mobile video captured with geo-referencing capabilities can be formatted for use within a GIS platform with hyperlink attribution. The video segments include embedded directional and vector displays for efficient locational orientation.

Capture3

Capture1Applications for this product may include:

  • Pavement analysis

  • Pre-construction documentation

  • Code enforcement

  • Asset inventory

  • Urban planning

Capture8

Capture7

Capture6xx


May 05

WROC 2015 imagery and lidar acquisition complete

Spring 2015 WROC 6-inch orthoimagery

On Thursday (April 30, 2015) the final flight lines of the Wisconsin Regional Orthophotography Consortium (WROC) 2015 mapping program were flown. The WROC contractor team of Ayres Associates and Quantum Spatial deployed 10 aircraft with precision aerial sensors over dozens of counties to capture the imagery in a short window of opportunity after snow had melted and before leaves had emerged on vegetation.

WROC is a multi-entity group whose goal is to build and sustain a multi-participant program to acquire digital orthoimagery and elevation data throughout Wisconsin, for use in tasks ranging from tax assessment to emergency management. WROC 2015 marks the fifth time a regional consortium has worked together with this goal in Wisconsin, dating back to 1995.

The spring imagery flights kicked off on March 17. Over the next 45 days, the WROC team collected high resolution imagery over 43 member counties. On separate missions the team collected aerial LiDAR (light detection and ranging) for topographic mapping over 13 counties.

Ayres and Quantum will process the new aerial imagery to create highly accurate orthoimagery that will be ready for delivery later this year. The orthoimagery is a critical data layer for tax assessment, engineering, planning, parcel mapping, and emergency management applications for county land information departments in Wisconsin. In addition, many municipalities took advantage of the program to collect higher resolution imagery and LiDAR for city planning and engineering purposes.

WROC partners are chipping in to help fund the imagery and LiDAR projects in exchange for access to the spatial datasets. Partners include utilities, electric cooperatives, tribes, municipalities, and state and federal agencies.


Apr 27

31,211 Square Miles of LiDAR in Wisconsin

Since 2004, Ayres Associates has provided aerial LiDAR services for 41 Wisconsin counties.  We’ve acquired over 6,500 square miles of LiDAR in 2015… and counting!

LIDAR_Inventory_new

For over a decade these LiDAR projects have supported a wide range of applications around the State- from floodplain delineation to forestry analysis.  While designed to meet FEMA accuracy standards for floodplain analysis, counties and municipalities are finding unique applications for these rich data sets.  LiDAR data is now an important tool for a diverse range local government departments: engineering, highway, public works, land information, planning and zoning, forestry, public safety, etc.

 DSM-vilas2


 TrempCo_Arcadia2

Ayres has assisted many of these counties with securing funding assistance- whether through public and private partners, or through state and federal grants.  As an example, LiDAR services made up a significant part of the 2010 WROC program. Twenty counties completed countywide LiDAR projects through that program, totaling more than 12,000 square miles. Eighteen of these counties received federal grants that covered 100% of their project costs through the Federal Emergency Management Agency (FEMA) Community Development Block Grant – Emergency Assistance Program. Ayres Associates worked closely with state and federal agencies associated with this effort, helping to secure funding and ensuring WROC members were in a position to take advantage of the opportunity. The LiDAR projects have been accepted into FEMA’s floodplain mapping program without exception, each exceeding FEMA’s standards for accuracy and completeness.


Apr 23

Another Successful Aerial Imagery & LiDAR Flight Season for GIS Consortium

lakeshore

Ayres Associates wrapped up another year of aerial imagery and LiDAR missions for the Illinois GIS Consortium.  This marks 15 consecutive years of aerial mapping missions for these Chicago area communities.


Digital Aerial Imagery

northwesternApproximately 90 square miles of high resolution aerial imagery was acquired this spring using an UltraCAM Eagle digital imaging system. The imagery captured for the 12 participating communities will be used to support a myriad of municipal services including engineering, planning, and public safety.


gisc_2015Up-to-date planimetrics and orthoimagery derived from imagery are key elements of the Consortium’s GIS base mapping program.


High Density Aerial LiDAR

lidar2Additionally, Ayres Associates captured high density LiDAR for approximately 30 square miles. LiDAR is becoming an increasingly useful tool for the Consortium- the high density data (20 points per square meter) is being employed by these communities for wide-area topographic studies and for micro-drainage issues in stormwater analysis.


Zoomed_Out_Ortho_and_TreesThe high density LiDAR data will also support extraction of planimetric information- including traditional 2D planimetric feature compilation of impervious surfaces or complex 3D modeling of buildings and tree canopies.  This provides the Consortium with the flexibility to build new customized products and efficiency through reduced number of aerial mapping missions needed in this high air traffic environment around O’Hare International and other regional airports.


ohare_20152The Illinois-based GIS Consortium (GISC) is a group of 23 communities in the Chicago region that work together to develop GIS solutions.   The GIS Consortium continues to expand the use of digital cameras for specialized municipal mapping applications.

ohare_2015This technology has allowed the participants to acquire high accuracy, high resolution aerial imagery at a lower cost. Unit pricing based on volume of participation has also translated to significant savings – discounts up 40% are being realized for individual communities. We offer the benefits of this cooperative effort to all communities in the area; formal membership in the Consortium is not required.


For more information about the GIS Consortium, please visit: www.gisconsortium.org


Mar 13

GIS Consortium featured in Spring issue of TRENDS

Trends_Cover

The GIS Consortium and the Village of Tinley Park, Illinois are featured in the current issue of TRENDS.

“Supportive solutions: GIS Consortium provides cutting-edge data to impacted communities” By Bob Brown

Read the article here:  http://www.ayresassociates.com/wp-content/ayres_images/GIS-Spring15.pdf


TinleyHousesWithContoursThe Illinois-based GIS Consortium (GISC) is a group of 29 communities in the Chicago region that work together to develop GIS solutions to support a wide range of applications including municipal engineering, planning, forestry, and public safety.  Find information about the Consortium here: http://www.gisconsortium.org


Read other recent blog posts under the GIS Consortium category: http://www.ayresgeospatial.com/category/gis-consortium/


Older posts «

» Newer posts