
Using multiple LiDAR surface models for detecting and monitoring change in topography over time.
by Mike Seidel (Geospatial Services Technician) and Jason Krueger (Project Manager)
Local government entities are building new applications for Lidar that go far beyond the typical stormwater and floodplain applications. For example, we have written several articles on this blog site about vegetation and building extraction from Lidar. This article will focus on the application of Topographic Change Detection Models where the data users have access to multiple Lidar datasets.
 With the recent advancements of sensors and the availability of economical software suites, the costs for the investment in Lidar have dramatically fallen. Counties and municipalities are now budgeting for topographic mapping updates or replacement every few years. This has given rise to the feasibility of systematic change detection monitoring over extended periods of time and facilitates proactive responses to developing trends.

Applications
 Change detection models allow the data users to quantify and qualify areas impacted by excavations, new construction, erosion, and even shifting river deposits. It provides clear signs of growing stormwater drainage issues in new developments and evidence for zoning and building compliance.

The Process
Topographic change detection requires suface data from at least two different dates. The most common form of topographic data for GIS software is the Digital Elevation Model or DEM. Other sources of topographic data (such as a TINs) can also be used.
First and foremost the surfaces must be registered to the same coordinate system. It is very important that the data is horizontally and vertically checked for accuracy as inaccurate data will skew the results of the change detection. Once data quality is ensured the difference calculation can be run. It is also recommended that the GRID cell size is consistent between the two datasets, but not absolutely necessary.
GIS Processing
To perform a change detection across surfaces in ArcGIS the Spatial Analyst extension is needed. Both grids are loaded into the software and a raster calculation is performed where one grid is subtracted from the other on a pixel by pixel basis. This process varies is duration based on the size and resolution of the data sets
For the purpose of demonstration, we took Lidar data from two separate missions that we completed for the Bismarck-Mandan area of North Dakota. In this exercise we subtracted a 2009 DEM surface from a 2013 DEM surface of the same project extents. The 2009 data had a spatial resolution of 5m, while the 2013 data had a spatial resolution of 1m. The resultant data set is produced in the highest common resolution, which is this case was 5m.
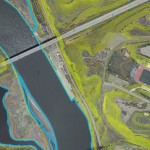
2009 Orthoimagery

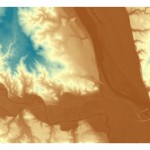
2013 Orthoimagery

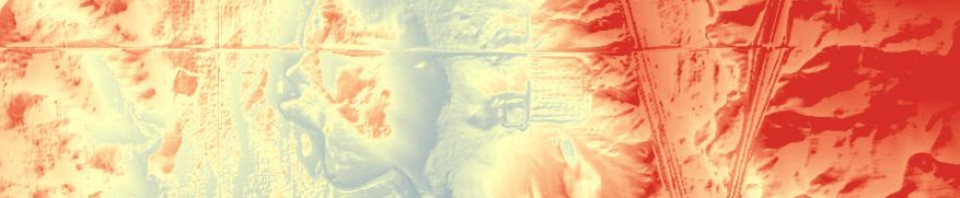
Processed Topographic Change Detection Model (2013-2009)

The Products
What results from this analysis is a “difference grid” that displays areas where elevations have changed. This dataset can then be run through additional steps to derive supplementary products such as contours of change or areas of change delineated by polygon. The supplementary products are particularly useful when overlaid with the difference grid to highlight area of extreme change. The resultant grid can also be used for quantitative analysis including volumetric calculations and the like, or qualitatively in geovisualiztion software where layers such as ortho imagery can be draped on the 3D surface to get a realistic view of topographic changes.
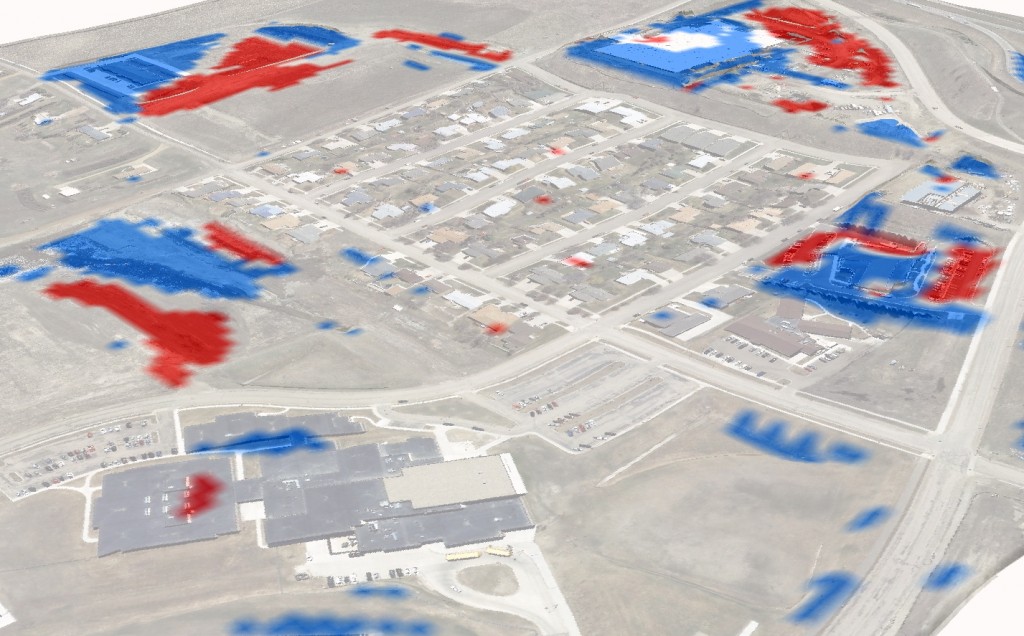
The outputs from this example include raster and vector products. The Topographic Change Detection Model is a raster layer indicating amount of change. This is generally prepared as an Esri GRID product. Additionally, we delineate areas of change with vector polygons- this can reflect customized minimum size and vertical change thresholds. It can also be output to “contours of change” by pre-determined intervals.
Topographic Change Detection Model and Contours of Change (2013-2009)


Recent Comments