Remote Sensing to ID Ash Trees in Urban Forest near Chicago, Illinois
Multispectral Imagery, Aerial LiDAR, and Ground Truthing Provide a Full Picture of an Urban Canopy
By Jason Krueger, Ayres Associates; Jason Carlson, Applied Ecological Services; and Dr. Fugui Wang, Applied Ecological Services
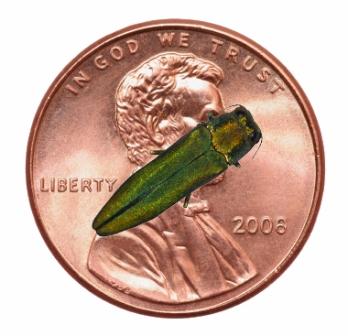
The greater Chicago region has been deeply affected by the Emerald Ash Borer (EAB) – an invasive species that has done considerable damage to the urban forest canopy. Targeting ash trees, a common and aesthetically popular part of suburban terrace landscapes, EAB has required a swift and costly response by many municipalities.
 A recent survey of tree species by the Village of Tinley Park has revealed that most of its 11,000 ash trees within public property had been infested by the invasive beetle. The results are devastating – much of the urban forest canopy was already dying when the Village made the difficult decision to remove nearly 10,000 susceptible trees within those public areas. Here’s a link to an article on the Village’s website which details their efforts to remove and replace ash trees within public areas: http://www.tinleypark.org/index.aspx?nid=648
Although Tinley Park and other communities are taking an aggressive approach to combat this beetle, their efforts are focused on the public spaces- particularly on road right-of-ways. However, many susceptible or dead ash trees remain on private lands where they are no less a problem. These dead and dying trees still have significant impacts on municipalities and pose potential safety hazards for homeowners. A contraction of urban forest may impact stormwater runoff- causing localized flooding and erosion. Loss of tree canopy may also lead to reduction in air quality and higher cooling costs in the summer. Dead and stressed trees can also pose threats when they lose large limbs or topple.
To help communities prepare for these impacts, Ayres Associates has been working closely with Applied Ecological Services (AES), of Broadhead, WI to develop methodologies for mapping urban forests and identifying ash trees (genus fraxinus). We have been focusing our efforts on the Village of Tinley Park, Illinois where we’ve collected an abundance of geospatial data over the past 5 years. Tinley Park, as part of the GIS Consortium (www.gisconsortium.org), has received high density aerial LiDAR and multiple aerial imagery products from Ayres Associates to support a robust GIS platform, supporting a wide range of municipal services. The impacts of EAB and the availability of geospatial data made the Village an ideal target for multiple related R&D efforts.
 Our previous R&D initiatives at Tinley Park have focused on tree canopy extraction and detecting affected trees. Ayres and AES are taking this previous work a step further by utilizing geospatial data for identifying tree species, with primary focus on the ash tree group classification.
Multiple Data Sources
This effort used strategically timed multi-spectral ortho photography, LiDAR and existing field derived tree inventory data to map and characterize tree canopy extents for Tinley Park. Two dates of ortho photos were used: 1) a spring-June 2013 and 2) fall-October 2014. In addition existing LiDAR point cloud data were used to derive feature heights and 2013 GPS tree inventory data were used to train the classification as well as validate accuracy of results.
Summary of available data sources:
• 4-band aerial imagery, 3” GSD, collected with an DMCII camera in March 2011.
• 4-band aerial imagery, 3” GSD, collected with an UltraCAM camera in March 2013.
• 4-band aerial imagery, 5.5” GSD, collected with an RCD30 camera in June 2013.
• 4-band aerial imagery, 5.5” GSD, collected with an RCD30 camera in October 2014.
• Aerial Lidar, 20 points per square meter, collected with a Trimble Harrier 68i in March 2014.
• Street tree inventory (2013), geodatabase, provided by Village of Tinley Park.
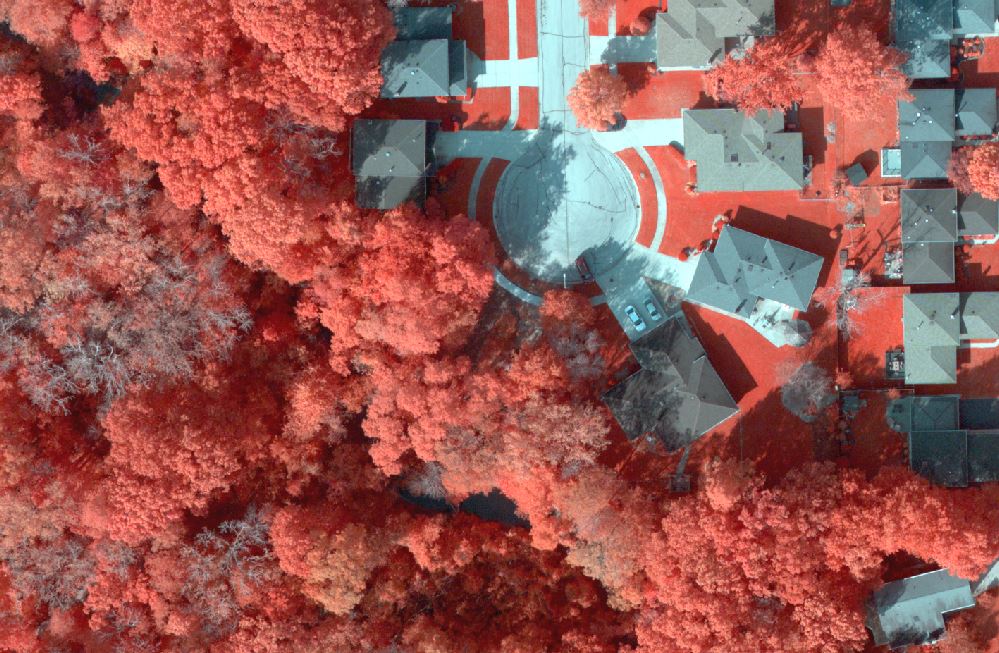
Orthoimagery with “high vegetation” Lidar classification
 Lidar Point Cloud (20 pts/square meter)
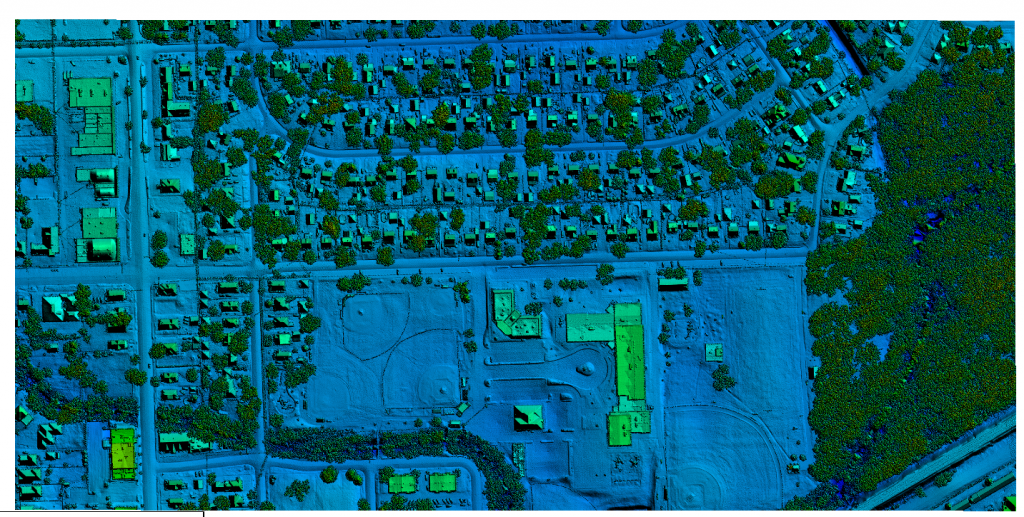
Lidar – First Return DSM (20 pts/square meter)
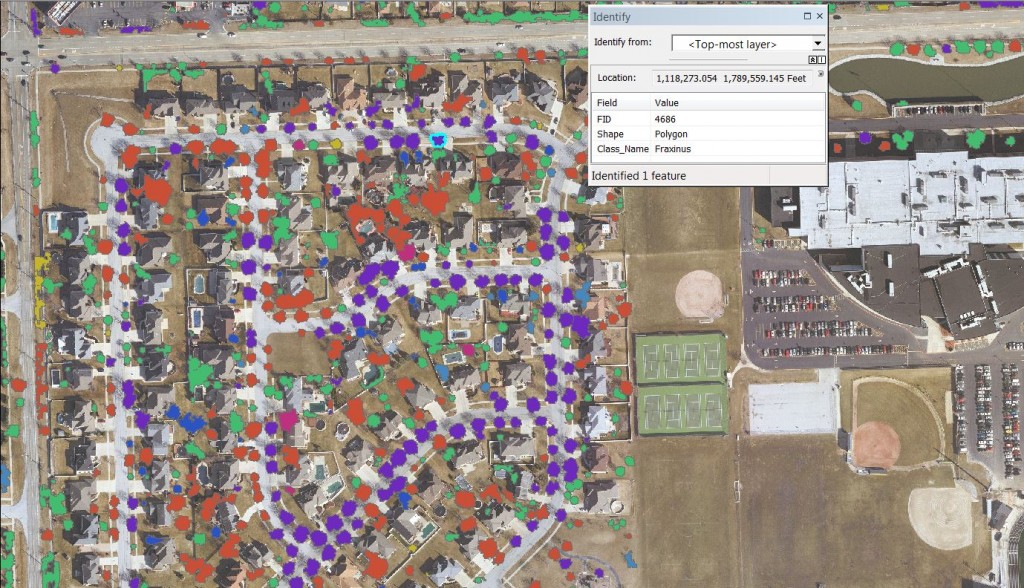
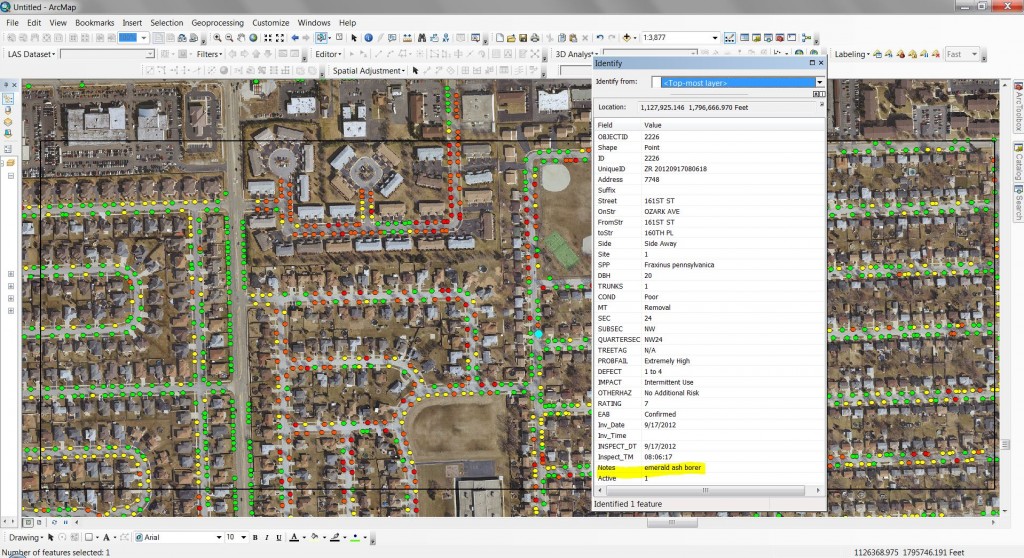 Street Tree Inventory Provided by the Village of Tinley Park
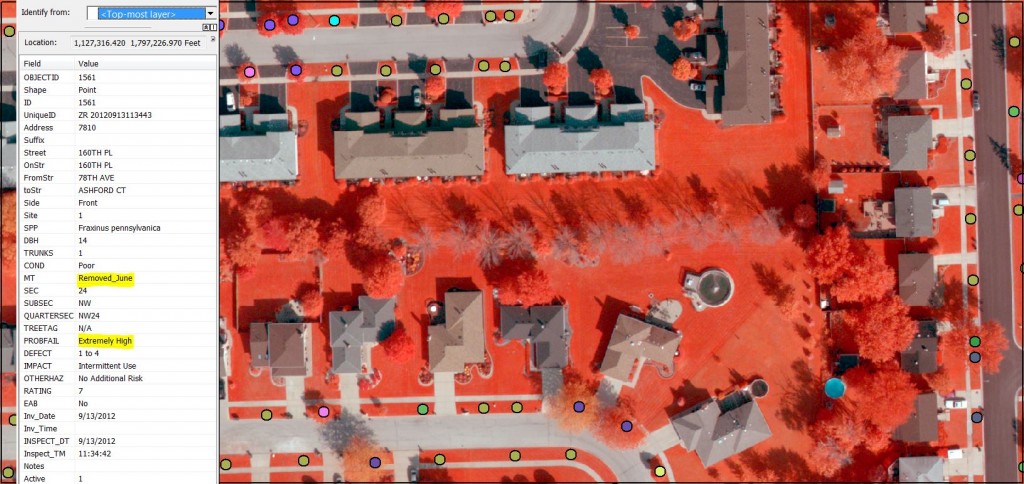
Four-band, Leaf-on Orthos – Showing Dead Trees on Private Land vs. Street Tree Inventory
Classification
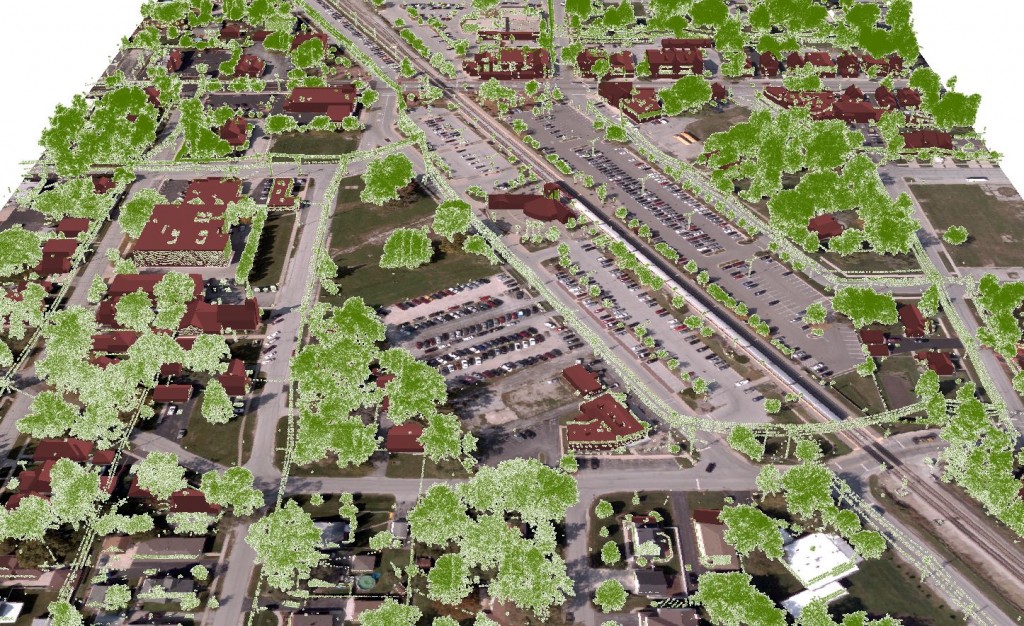
The classification focused on mapping tree canopy extents as well as characterization of dominant tree species groups: ash, honey locust, linden, maple, callery pear and oak. All other species were aggregated into a minor/other class. The canopy classification utilized a state-of-the-art segmentation process capable of producing polygons that represent real-world objects. This type of classification process has proven to be more effective, efficient and more accurate as compared to traditional pixel-based classification methods. This method really excels when applied to mapping distinct edges in combination with area that are spectrally heterogeneous.
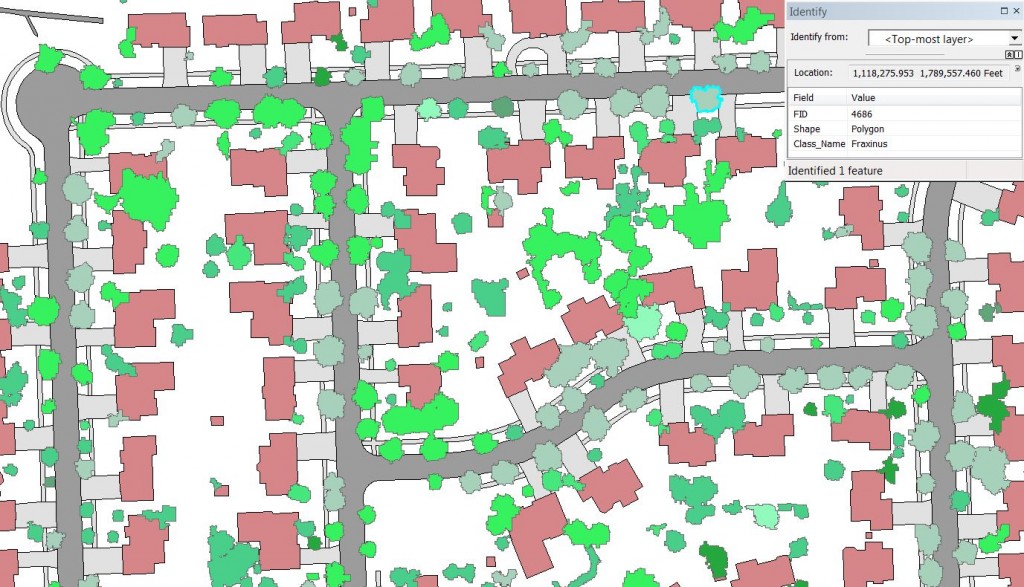
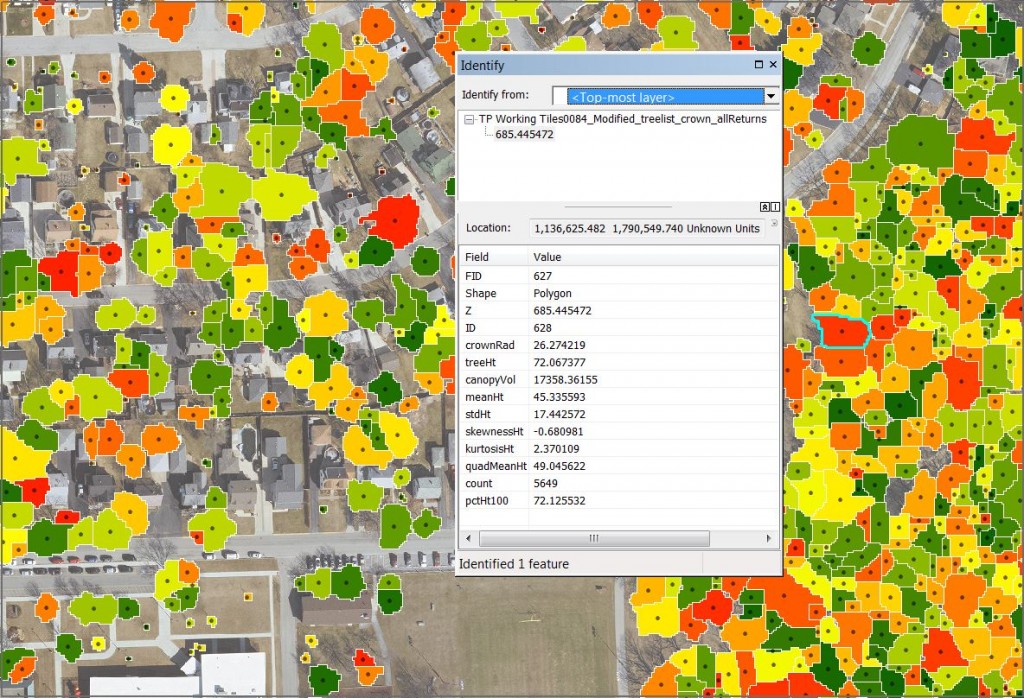
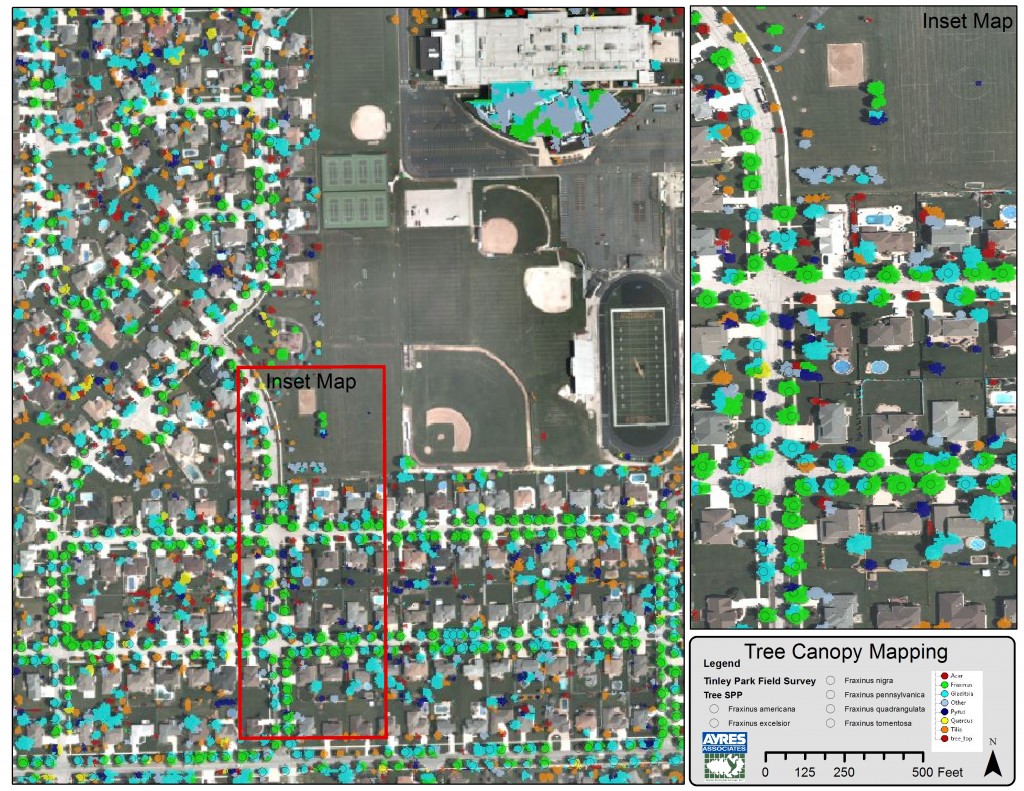
Vectorized Canopies with Genus Attribution
The classification consisted of three key steps: 1) tree canopy delineation, 2) classification, and 3) accuracy assessment. The tree canopy was delineated based on characteristics of color variation (orthos) and feature heights (LiDAR). Canopy delineation was the result of a number of developed segmentation rules which utilized various algorithms to represent individual tree canopies rather than groups of trees. By identifying individual trees we were able to better characterize attributes of forest stand, such as numbers of trees and distribution of canopy extents.
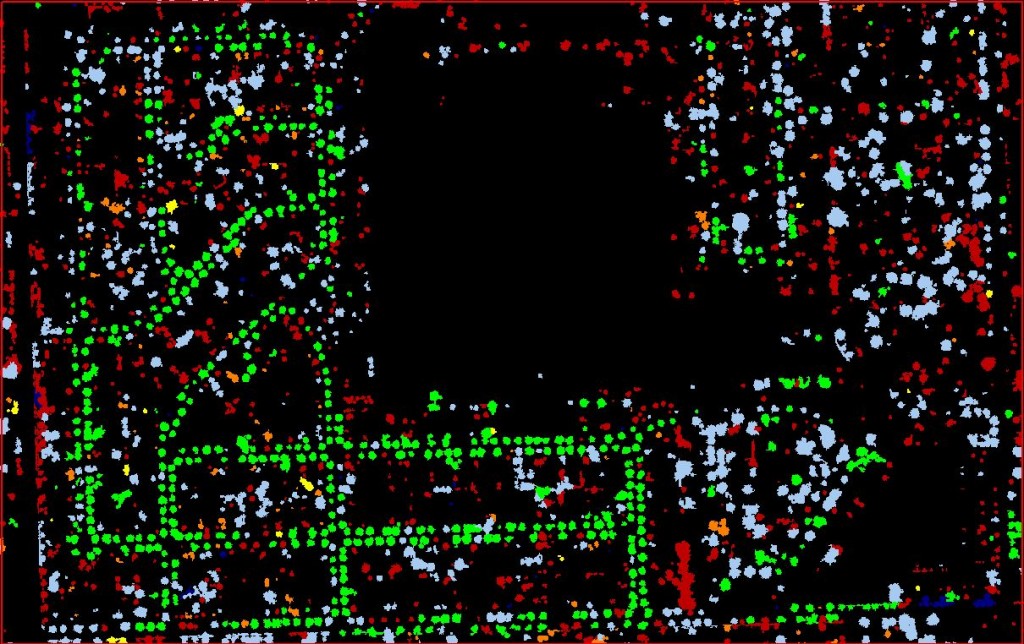
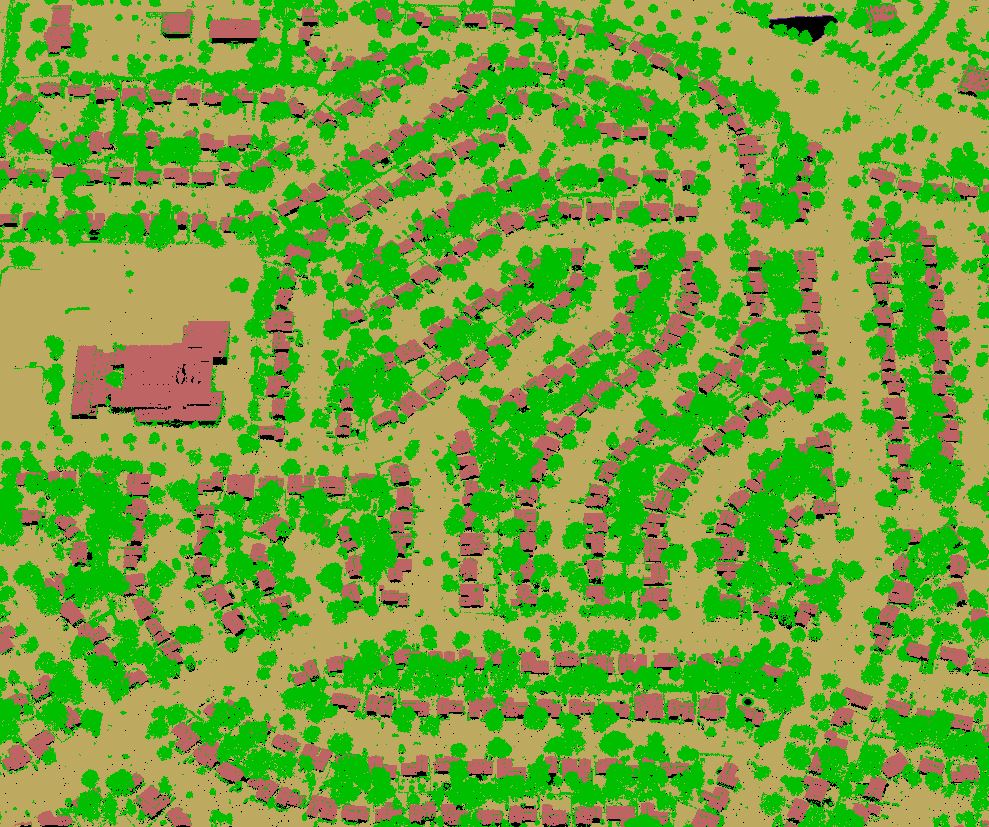
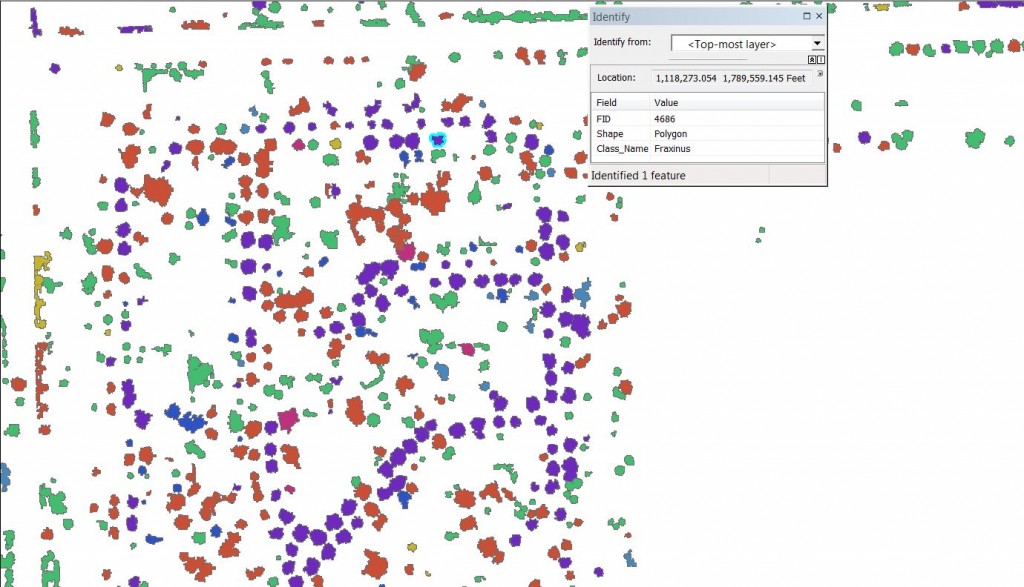
Canopy Classes – Rasterized
The classification utilized all data layers mentioned above and a random forest algorithm. For each representative tree that was delineated in step 1, spectral/statistical values were compiled and utilized in the classification of tree canopy types.
Accuracy Assessment
For the accuracy assessment, 514 of 1277 surveyed trees were used as independent validation data set. The accuracy assessment shows that the producer and user accuracy of the ash tree classification were 60% and 80% accurate. The producer’s accuracy refers to the probability that a species of trees surveyed on the ground is classified as such. This value represents how well reference pixels of the ground cover type are classified. The user’s accuracy refers to the probability that a certain species of tree labeled on the map actually represents that category on the ground. User’s accuracy corresponds to error of commission, and producer’s accuracy corresponds to error of omission.
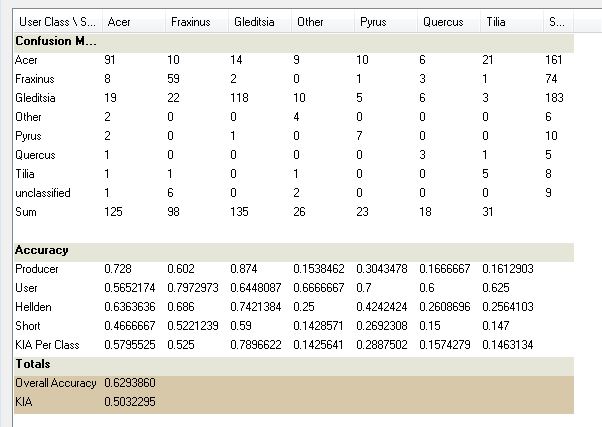
In addition, the classification procedures resulted in high accuracy for maple and honey locust species. As expected, the producer accuracies remained relatively low the other species not the focus of this mapping effort. Additional steps of class aggregation and/or modified timing of imagery mission may be necessary to achieve greater accuracy levels for the other, non-ash tree groups.
Summary
While performing street tree inventory and diagnostics may be effectively accomplished in the field, it may not be an efficient approach for a systematic survey of forest preserves, private property, or even an entire community. This is where geospatial data and remote sensing can be used to greater effect to aid in broader urban forest management.


Recent Comments