May 24

Unmanned Aerial Systems – one tool in the geospatial toolbox

Unmanned Aerial Systems (UAS) have become an established tool in the survey, mapping, and engineering fields. Incorporating these aerial imaging and mapping platforms into our services is adding new dimensions and perspectives as we measure, observe, and inspect project sites and structures. This technology excels in situations where site safety and accessibility are a concern. Due to its ease of mobilization, UAS provides an economical means to frequently monitor or measure a site.

Inspection/Observation Applications

While UAS may never replace the human element of a professional inspection or construction observation, this technology has proven to be a useful tool to provide new aerial perspectives. Applications to apply UAS acquired high definition imagery and video include:

  • Scouting missions prior to “hands-on” structural inspection
  • Construction progress monitoring
  • Structural condition reports
  • Documentation for traffic and parking studies
  • Storm damage assessment

Mapping Applications

UAS systems can support high-accuracy topographic mapping and 3D modeling. This technology provides high-definition surface models for contour generation and volumetric calculations with rapid deployments and quick turnaround times. Unmanned aerial systems are especially effective at mapping sites that require frequent updates, and to provide access to potentially hazardous work environments.

Ayres Associates uses flight planning and data processing software specifically designed for UAS technologies. Skilled aerial mapping technicians employ customized workflows and quality checks to ensure that data will be delivered to meet your needs. 

Our mapping capabilities include:

  • Digital surface models and contour generation
  • Volumetric analysis and topographic change detection
  • High-resolution orthoimagery
  • Planimetric mapping
  • 3D modeling

Qualified UAS Pilots

Successful projects start with safety. Ayres Associates completes all UAS projects in accordance with the FAA’s Part 107 regulations. Our pilots in command are all properly certified and complete strict internal training, both in an office setting and in the field. All personnel follow strict safety protocols and have invested the time needed to understand and appreciate the risks of the work environment before deployment of UAS equipment.

Mar 06

“Orthos 101” webinar coming May 3, 2018

Capture_ortho101The science behind aerial imagery, orthoimagery production, and photogrammetry, and what it means for Wisconsin

Our aerial mapping experts will be hosting an “Orthos 101” webinar on May 3, 2018 at 1pm.

In today’s world of drones, obliques, and LiDAR (light detection and ranging), you may be asking yourself if the principles of photogrammetry still matter. We assure you that they definitely do! In fact, the science behind aerial imagery and photogrammetry is more relevant today than ever.

In this webinar, our aerial mapping experts will review the basics of aerial image acquisition, airborne GPS, ground control, aerotriangulation (AT), orthorectification, orthoimage editing, and ortho mosaicking.

We’ll review the concepts of digital photogrammetric mapping, with a focus on features that can be accurately mapped from common scales of aerial imagery. Lastly, the webinar will cover the newest industry specifications and standards for high-resolution orthoimagery and reiterate why it matters in Wisconsin.

Webinar registration link will be coming soon. Stay tuned!

WisRapidsDam CIR

Dec 28

Integrating Unmanned Aerial Systems (UAS) with Geospatial Services

Plan and profile view of stockpiles at an active construction site.

Plan and profile view of stockpiles at an active construction site.

Ayres Associates has always been driven to develop the best solutions to fit our client’s needs by utilizing a combination of advanced technologies and work flows.  So, it should not be surprising that Ayres has embraced the use of Unmanned Aerial Systems (UAS) and now regularly integrates the data from such systems into its project solutions.

The key, however, is to know how to accomplish this integration accurately and efficiently.  Many UAS or drone-only operators are focused on the flying portion of the equation and have simply used out-of-the-box push-button software to deal with the data they collect with their UAS to make maps and have few tools to perform QA/QC on their data. Even if these operators have taken the time to add ground control points, teasing truly accurate data out of UAS data can be problematic.  On the other hand, Ayres Associates has extensive aerial mapping experience with large and complex data sets and the computers and the professional software suites necessary to generate accurate contours, surface models, and planimetrics.  While we may use common software like Pix4D as one part of our work flow, we are rarely satisfied with the output solely from this software since it’s not always the best tool for a bare earth surface model.  Often times we complete the process with one of our many professions software suites.

These are all issues related to dealing with just UAS data alone, without considering the expertise required to combine UAS data with data from several sources.  Ayres Associates has completed projects that involve integrating data from UAS, manned aerial photography, along with aerial, mobile and static terrestrial LiDAR and ground survey.  We have extensive experience with all of these different types of data, so we can efficiently apply them to projects as needed.


There are projects where the best solution is to acquire aerial lidar combined with imagery of the overall site, mobile LiDAR on the roadways, static LiDAR under the bridges, ground survey within wooded areas or to capture critical drainage features, and UAS to capture areas that may have changed since the overall flight was completed.

DTM shaded GWA150tall

These are some of the issues that Ayres Associates addresses while combining data sets derived from different technologies:

  •  When designing the project data collection effort, it is imperative that you consider the different levels of accuracy of each technology and how to best apply each method to the appropriate areas of the project site.
  •  Your control survey needs to be designed to accommodate the different requirements and accuracies of each technology.  Some technology needs greater accuracy vertical control to allow it to fit with adjacent data sets, such as using differential leveling versus GPS or total station derived elevations on control points.
  • When combining all these different data collection techniques you must be careful to track the collection dates and location/extent of that portion of each data set used.  This is very helpful in conveying to the client the full story of the base data that their project is built on.  Some projects have data collected over a span of several years and it is very helpful to know the currency of each data set and when to replace portions of your data that no longer reflect the current field conditions.
  • You need to decide if you will combine the data into one seamless data set or do you maintain separate data sets and utilize software functionality to use all the data at one time.
  • With overlapping data sets you must decide where to best transition from one data set to another while maintaining an accurate representation of the actual field conditions and providing a smooth 3D surface free of jumps in the data.
  • The different acquisition technologies have varying data densities (distance between data points) that affect the visual representation of the surface model.  You may have static LiDAR data with millions of data points collected only hundredths of a foot apart immediately adjacent to conventional ground survey with data points being 10 to 20 feet apart.  This data looks very different when presented side by side.  This is where it is very important to pick a good transition location and the length of that transition.
  •  The visual representation of different data sets should be uniform or if you want users to notice that there is a different source you may want the data sets to look different.

Each technology has it strengths and its weaknesses.  Knowing where to use each and how to apply them is critical.  Unmanned Aerial Systems are relatively new and you need a firm that can recognize, test and confirm those strengths and weaknesses as the technology rapidly progresses.  You don’t want the latest fad in technology to be applied to your project without it being thoroughly tested.

Ayres Associates recently added a DJI Matrice 200 UAV with a Zenmuse X4S sensor to our fleet to address our growing demand for UAS data integration.  As FAA regulations governing UAS operations evolve, Ayres and Associates will continue to expand our UAS offerings and the integration of this technology with our firm’s already extensive capabilities.

Dec 20

High Density Lidar for Colorado DOT Applications

Republican River

High Density Aerial Lidar of Wray, Colorado

(CDOT Front Range NPS – Region 4 – Riverine Design & Analysis)

republican_river7Ayres expands upon its use of high accuracy Lidar for important transportation corridor design and improvement projects throughout Colorado.  In the past year, our Aerial Mapping Services group has been working closely with our engineering staff in our Fort Collins office to support a diverse team of professionals.

As an example of how geospatial data is employed, Ayres is managing the floodplain permitting and support of the hydraulic design for two US-34 bridges over the North Fork of the Republican River in Wray, Colorado. This project is being performed under a master contract for Riverine Design and Analysis for Region 4 of the Colorado Department of Transportation.

100-year model showing flow vectors and water surface color contours

100-year model showing flow vectors and water surface color contours

republican_river6The flow at the bridges and through the town includes multiple split flow reaches and complex hydraulics as well as more than a half-dozen bridges beyond the primary two bridges of concern. Ayres is developing a 2-dimensional SRH model and 1-dimensional HEC-RAS model for the entire reach including the bridges and the town.High density Lidar and high resolution orthoimagery was collected for the entire project area in late summer 2017. This data is being used for the hydraulic modeling and also by the CDOT roadway and bridge design teams for the two bridges and the roadway interfaces. The Lidar was acquired at a density of republican_river58-points per square meter to support a surface model that achieves vertical accuracy of 0.3-ft, or greater.  The resultant surface achieved 0.1-ft, at the 95% confidence level.

Aerial imagery was acquired simultaneously with the Lidar acquisition and was delivered as 3-inch resolution.  The paired sensors provided two distinct advantages for this effort: a) lower flight cost, and b) capture environmental conditions that are consistent between the imagery and the Lidar.


Oct 11

Baselines are Critical for Asset Management Solutions

Jason Krueger, manager Ayres Associates Geospatial Division, catches up with Jake Schneider, President and CEO of Cartegraph

Jason Krueger, manager Ayres Associates Geospatial Division, catches up with Jake Schneider, President and CEO of Cartegraph

Ayres Associates is excited to be sponsoring and attending the Cartegraph National Conference in Denver, Colorado, this week.

We partnered with Cartegraph earlier this year to bring our clients improved asset management solutions and offer the best outcomes possible to our many municipal and private clients around the country. While at the conference, we’re among the more than 300 attendees who are networking with and receiving training from industry experts on a wide range of topics, from organizational productivity and field time maximization to best practices and performance-driven decision-making. We’re hearing real-life examples, tips, tricks and more – all of which will help us better help our valued clients.

DSC_9123One of the aspects of this conference that piqued my attention is the wide range of backgrounds and job responsibilities amongst the users here. it ranged from administrators of holistic Cartegraph solutions within large cities to folks that have just launched their early implementation to solve very discreet issues within smaller communities.

The theme of several of today’s breakout discussions was a high-level look at analyzing the effectiveness of asset management solutions within organizations. The ability to easily and effectively manage assets and their attributes is changing the way local government services operate. However, simply implementing an asset management solution may not go far enough in determining if it’s being used effectively. Analysis starts with establishing a baseline level of information from which future decision-making is founded upon.

To help reinforce the importance of these baselines, an attendee in the session from Lone Tree, Colorado, shared their approach. They started with establishing their road network and conditional analysis using geospatial technology and well-established processes for rating condition. All maintenance and repairs to their City’s road networks going forward will now be informed by the data they collected and built into their Cartegraph OMS (operations management system) platform.

Cartegraph graphicAyres Associates can provide the key expertise needed to establish these baselines for municipalities. The first step in building the baseline in many cases starts with spatially locating above-ground assets such as road networks, water utilities, signs, and trees, as well as below-ground assets. Ayres offers a robust suite of survey services using aerial, mobile, and ground-based technology in addition to subsurface locational equipment. We also have expertise in providing municipalities with inspection services, which is critical for the initial attribution of the condition of the located assets.

Quint Pertzsch, Cartegraph Sales Engineer Manager,  highlights some of the report data displayed within OMS

Quint Pertzsch, Cartegraph Sales Engineer Manager, highlights some of the report data displayed within OMS

The powerful tools within Cartegraph OMS permits comparative analysis throughout the organization to measure efficiency and effectiveness against quantitative baselines. The dashboard applications of OMS provide a range of measurable analytics, such as expenditures, material costs, labor hours, labor costs, budgets, and schedules. Customized reports within Cartegraph can be prepared for key decision-makers and the greater public to help make informed decisions about investments and prioritization.

Together with Cartegraph, we’re continually working to bring our clients comprehensive, well-designed asset management solutions. Attending the national conference this week is allowing us to exchange ideas and further pursue these initiatives.

Ayres Associates, founded in 1959 in Eau Claire, Wisconsin, is a nationwide professional consulting firm providing services in transportation, civil, structural, river, utility, and water resources engineering; aerial mapping and land surveying; environmental science; planning; architecture; and landscape architecture. Ayres Associates provides services from a network of 12 offices across the country.

Aug 10

Capturing an Impressive Display of Aviation History

EAAx

Ayres Associates and Applied Ecological Services were granted the privilege to capture high resolution digital aerial imagery of the EAA AirVenture gathering in Oshkosh, Wisconsin.

EAA2xAyres and AES have been partners in aerial imagery acquisition and specialized remote sensing application for over 5 years.  Using a Leica RCD30 we have collaborated on projects ranging from mapping for departments of transportation to identifying and tracking invasive vegetation.  When given the opportunity to capture the 2017 EAA AirVenture we knew this would be a unique opportunity to document this important aviation event from a new perspective.

The AirVenture is an annual event hosted by the Experimental Aircraft Association, drawing nearly 600,000 aviation enthusiasts and over ten-thousand aircraft.  The event showcases both historic aircraft and the latest technology in aviation.  This event featured a wide range of attractions and events, including a performance by the Blue Angels, a fly-over of B-1, B-2, and B-52 bombers, a dozen B-25’s, and a reunion astronauts from the Apollo program.

The aerial imagery was acquired on the morning of July 25 at a flying height of 4,500 AGL.  The imagery was processed to four-band 6-inch resolution orthoimagery.  Here’s the Color IR output of the site:

EAA4x

EAA3x

Jul 25

UAS Rules for Recreational Users

 If you follow this blog – or follow the U.S. geospatial market – you know that operating a UAS or drone for commercial purposes is strictly regulated by the Federal Aviation Administration (FAA). Ayres Associates has been using UAS on projects for the past few years. We follow all 624 pages of the Part 107 regulations and adopted further internal standard operating procedures to ensure safe and successful operations. Our staff members publish blog articles and speak regularly at conferences to help educate the community on proper UAS use and have become experts in our marketplace.

We’ve fielded many questions about this fast-moving technology, but one question we haven’t addressed is “What if a person is not flying for commercial use?” We get this question from clients and in our social circles. Not long ago, a co-worker approached me with a story.

It was beautiful spring day, and he and his kids were riding their bikes at a local park when they heard what sounded like 1,000 bees bearing down on them. They looked left, they looked right, nothing. Then my co-worked looked up and saw the culprit. It was both his and his children’s first experience with a drone, and, if you haven’t heard one, they can be very loud. The drone followed them for about a minute and a half through the trails. While the family was not necessarily scared, the kids were a little nervous and certainly distracted. Having biked into the back of a parked car while looking over my shoulder and waving at mom when I was 5, I can understand my co-worker’s concern about his kids focusing on the buzzing drone instead of the trail and terrain before them. Monday morning, he stopped in and asked, “What can hobbyists do with drones?”

First, before anyone can fly in the United States, they must:

  • Be 13 years of age or older (if the owner is less than 13 years of age, a person 13 or older must register the small unmanned aircraft)
  • Be a U.S. citizen or legal permanent resident
  • Register the UAS if it weighs more than 0.55 pounds and less than 55 pounds. (Larger UAS requires a different registration).
  • Label the UAS with their registration number

Read and understand all safety guidelinesB4ufly_map

So, what are some of the safety guidelines for recreational drone users?

  • Fly no higher than 400 feet, and remain below any surrounding obstacles when possible
  • Keep the UAS in eyesight at all times
  • Never fly near manned aircraft operations. Operators must always see and avoid other aircraft and obstacles.
  • Stay five miles from an airport or heliport
  • Never fly over unprotected persons or moving vehicles
  • Remain at least 25 feet away from individuals and vulnerable property
  • Never fly over stadiums or sports events
  • Never fly near emergency response efforts, such as fires
  • Never fly under the influence of alcohol or drugs
  • Do not fly in adverse weather conditions, such as in high winds or reduced visibility
  • Ensure the operating environment is safe and that the operator is competent and proficient in UAS operation.B4UFLY_plan
  • Do not fly near or over sensitive infrastructure or property, such as power stations, water treatment facilities, correctional facilities, heavily traveled roadways, or government facilities
  • Check and follow all local laws and ordinances before flying over private property
  • Follow community-based safety guidelines, as developed by organizations such as the Academy of Model Aeronautics (AMA).
  • Do not conduct surveillance or photograph persons in areas where there is an expectation of privacy without the individual’s permission

All UAS/drone operators much be aware of their surroundings. Could you crash into a child or animal? Could you crash into your neighbor’s house or car? Are there power lines nearby?

Also consider who else is using the sky. Crop dusters, emergency operators, police, firefighters, and others regularly operate at low altitudes, and a drone can do a lot of damage to their aircraft. You should not be flying your drone near any of these.

The rules and guidelines may not be fully inclusive and could change frequently. It’s up to the operator to understand the current rules. If you want more information on recreational use of UAS, here are a few good resources:

http://knowbeforeyoufly.org/for-recreational-users/

https://www.faa.gov/uas/getting_started/fly_for_fun/

If you need further help, contact a local recreational flying club for guidance.

Note: Commercial UAS operators are more heavily regulated than recreational operators. They are licensed, better trained, and follow the FAA Part 107 regulations.

What is commercial use? Anything you can receive compensation for. Real-estate, wedding videos, consulting, data analysis, surveying, inspection, and marketing/promotional videos can all be considered commercial use.

Have a question about when and where you can (or can’t) operate a UAS? Comment below, and we’d be happy to follow up and get you an answer.

Jun 20

Ayres Expands Asset Management Offerings

Map

Asset inventory and management is nothing new to Ayres Associates. In fact, we have been mapping assets for decades, and just completed a city-wide utility infrastructure project for a private client within the past year. In short, Ayres knows assets, but a recent partnership with Cartegraph has allowed us to expand our asset management solutions in exciting new ways.

AssetsFor starters, it is important to know what asset management is and what it is not. The Institute for Asset Management defines Asset Management as a system of coordinated activity within an organization to realize value from assets. It involves the balancing of costs, opportunities and risks against the desired performance of assets, to achieve the organizational objectives. This is to say – assets such as roadways and fire hydrants are valuable and need to be proactively managed to ensure the best return on investment. This is where Ayres comes in.

Whether it is extracting asset locations from stereo imagery, mobile LiDAR and survey data, or performing structural inspections, Ayres has a unique capability to fuel asset management systems from the ground up. This ability to not only map assets, but inspect and manage them is something that few geospatial firms can offer and highlights the multidisciplinary nature of Ayres’ service offerings.

Traditionally, asset management has lived in a world of spreadsheets and paper work orders. While Ayres has been on the forefront of mapping assets and delivering digital data in the form of GIS compatible databases, Cartegraph’s solutions take things one step further. In Cartegraph, interaction with assets is done almost exclusively through web and mobile applications. While the backbone remains a robust GIS database, Cartegraph leverages esri’s ArcGIS Online and ArcGIS server for security, authorizations, data storage, and integration allowing for end users to interact solely through the application. It is a simple yet powerful interface that allows clients to be up and running with minimal training.

Kew12

Cartegraph offers two tiers of asset management solutions for governmental entities: Asset Management System (AMS) and the more robust Operational Management Systems (OMS). AMS involves the basic collection of asset locations and the creation of standard tasks involved in the day-to-day management of said assets. OMS builds on this established foundation with enhancements for things like advanced configuration, preventative maintenance, and scenario building which help stakeholders and decision makers realize the true value or proactively managing their essential infrastructure.

As time passes and infrastructure ages it is important that we do everything in our power to manage it wisely. Tools such as Cartegraph OMS and the services provided by Ayres Associates are what is needed to keep roads safe, storm sewers reliable, and all our essential assets operating in a cost-effective manner.

Jun 14

Wisconsin LiDAR data compatibility

A number of events have occurred over the last several years that are important to be aware of when using Wisconsin LiDAR .las datasets in GIS software. Here is a timeline of these events:

2014

  • LAS version 1.4 becomes the industry standard point cloud file format

2015

2016

  • Wisconsin countywide lidar required to meet USGS OGC well-known-text (WKT) standards
  • ArcGIS v10.4 software has issues projecting .las files with USGS compliant WISCRS WKT


So what’s the problem? If you are using .las datasets in Wisconsin from 2016 or later, be aware that ESRI may not be reading the .las files properly. The most common error is an ‘inconsistent extent warning’. Some users can load the .las data with a projection warning, but it cannot be viewed in ArcMap. The main issue is that ESRI is expecting a standard parallel value that is not part of the USGS WKT. See screenshots below for a comparison between USGS and ESRI coordinate definitions:

USGS projection information:

USGS_OGC_WKT

ESRI projection information:

ESRI_WKT

How can you help? We have made ESRI aware of this issue. If you are experiencing an issue with properly reading .las files in ArcMap v10.4 or later, please contact your ESRI representative and refer to case #01934862, which we have initiated on this topic. If you are experiencing this issue with Wisconsin LiDAR data produced in 2016 or later, please contact us, and let us know the specifics.


Matt Vinopal: vinopalm@ayresassociates.com

Zach Nienow: nienowz@ayresassociates.com

Jun 09

Ayres Associates Works with Kids at the Children’s Water Festival in Fort Collins, CO


Horsetooth

Staff from Ayres Associates recently had the opportunity to do a series of presentations at the Children’s Water Festival in Fort Collins, CO.  The 26th annual festival is an opportunity for professionals from a wide range of water related professions to come together and educate over 1,800 third graders on the importance of water through a wide range of topics. These topics range from learning about pollution, aquatic wildlife, water resources, supply and conservation, water chemisty and much more.

WaterFest2Ayres Associates Geospatial Project Manager, Jim Kelly, teamed up with the City of Fort Collins Water Field Operations Special Projects Manager, Andrew Gingerich, for a presentation titled Water Quest.  In the presentation, Jim and Andrew taught kids about the importance of having access to clean water, where Fort Collins water comes from and how it’s distributed throughout the City.  Key to the presentation were the maps and aerial imagery used by the City to track, maintain and design the over 560 linear miles water distribution system beneath the streets of Fort Collins.

Using interactive maps with aerial imagery, the presentation showed kids where the headwaters of Fort Collins water sources originate and then followed a path through the series of rivers, tunnels and reservoirs used to transfer the water across the continental divide to the City’s water production facility.  The kids were then able to view the sprawling water distribution network on a map while Andrew discussed the tremendous effort involved in designing and maintaining the water system in order for the kids to get clean water every day.WaterFest

Watching the reaction of the children as they slowly realized that water doesn’t just appear when they turn on the faucet is truly an amazing experience.  Being able to visually follow the maps showing them how far the water travels and how vast the pipe network below the streets literally opened their eyes and allowed them to understand how important clean water is and how lucky we are to have such easy access to it.

Opportunities to work with our local community and teach kids about the importance of clean water and map technology is one of the more rewarding aspects to working at Ayres Associates.  It’s easy to get consumed with the day to day workflows of what we do and having the opportunity to teach kids and watch their faces smile in awe of water systems and mapping technology is something we don’t get to do enough.


Apr 18

Droning on and on…Are drones destined for the trash?

UAS_Trash2No, drone technology is not going away. In fact, its use in the professional services marketplace is only expanding. One application we’ve developed expertise in is utilizing UAS to analyze landfills.

Landfills are often run as a business, and, like any business, operators make decisions based on metrics and try to increase efficiencies to improve the bottom line. With landfills, this comes down to how much discarded matter you can fit before the area is full. The better you compact the trash, the more you can fit – increasing capacity and life within the landfill.

So how can an unmanned aerial system, or UAS, help?

It can help more than most people realize, particularly when it comes to landfill applications.

Our team has completed multiple UAS missions at the Adams County (Wisconsin) Landfill, for example, using UAS_Airspaceinformation gathered to provide detailed topographic mapping data about the site and surrounding terrain. We’ve been using our UAS-gathered information to create three-dimensional surface models to support volumetric calculations and change detection analysis.

Landfills are licensed to hold a certain amount of material, dictated by the available airspace. As material piles up, the landfill’s limit will eventually be reached. Historically, we assessed this by sending surveyors into the field to collect measurements, but drone technology allows us to more efficiently provide this information – and then some. Whereas traditional survey provided a point of information once every 50-feet, drone technology can deliver survey shots every two centimeters – giving our landfill operators a more complete picture of the available airspace and how much volume they have left to fill.

Additionally, with traditional survey methods, we typically focus on an explicit spot within a landfill where a landfill UAS_LandfillModelmanager knows change has occurred in recent months. A UAS can quickly (and economically) fly an entire project site, providing a more complete picture and looking for other areas of change due to subsidence or erosion.

If you plan to use the imagery as more than just a picture, such as the geospatial analysis described above, you will need to know more than simply how to fly a UAS. You should also factor in:

  • Surveyed ground control. This is the key to lock all data to known locations.
  • Quality flight planning. Proper planning allows for the right data to be collected for a specific analysis.
  • Good environmental conditions. Optimal conditions involve clear skies and low wind – and avoid rain, snow, and fog.
  • Understanding of photogrammetry. Simple push-button drone software is good at quick-and-dirty photo processing but leaves random errors which can skew analysis.
  • Understanding of surface generation. For an accurate product from imagery or a point cloud, significant editing will be needed to remove noise and non-surface features.
  • Understand the limits of your technology. If you’re using a camera system to measure the ground in an area with leafy trees, high grass, or dense crops, recognize that you might need to use a different technology. Ground features will be better captured during “leaf-off” seasons where obstructions like these are minimized.

UAS may never replace the human element of a professional survey or inspection, but this technology is already proving to be a useful tool to provide high-density data and analysis over entire project areas while limiting the time humans need to spend in hazardous environments.

So, unless you crash your UAS into a tree or back over it with your car, your UAS should be safe from the trash can. But, if the unfortunate does happen, Ayres Associates may be using our UAS to help assess just how much space yours is taking up in your local landfill.


Background

Ayres Associates currently has four pilots in command, and we complete our UAS projects in accordance with theUAS_PIC FAA’s Part 107 guidelines. Our pilots each complete strict internal training, both in the lab and in the field. All Ayres projects follow strict safety protocols, and our personnel invest the time needed to understand and appreciate the risks of the work environment before deploying UAS equipment.

When Ayres incorporates UAS on a job, we can say with confidence that we’ve carefully weighed the pros and cons of implementing this emerging technology on the project. Delivering high-quality products to our clients is our No. 1 goal, and, in certain circumstances, we’re finding UAS to be a helpful tool to meet that objective.


UAS_contours


Mar 30

Using Remote Sensing for Forest Regeneration Analysis

BlowdownForestry is the backbone of the Menominee Indian Tribe of Wisconsin’s economy. For 150 years, Menominee Tribal Enterprises (MTE) has managed the Tribe’s 235,000 acres and has become an industry leader in sustainable forestry.  In 2007, a tornado destroyed over 2,200 acres of prime hardwood forest, creating a massive impact on future revenue.

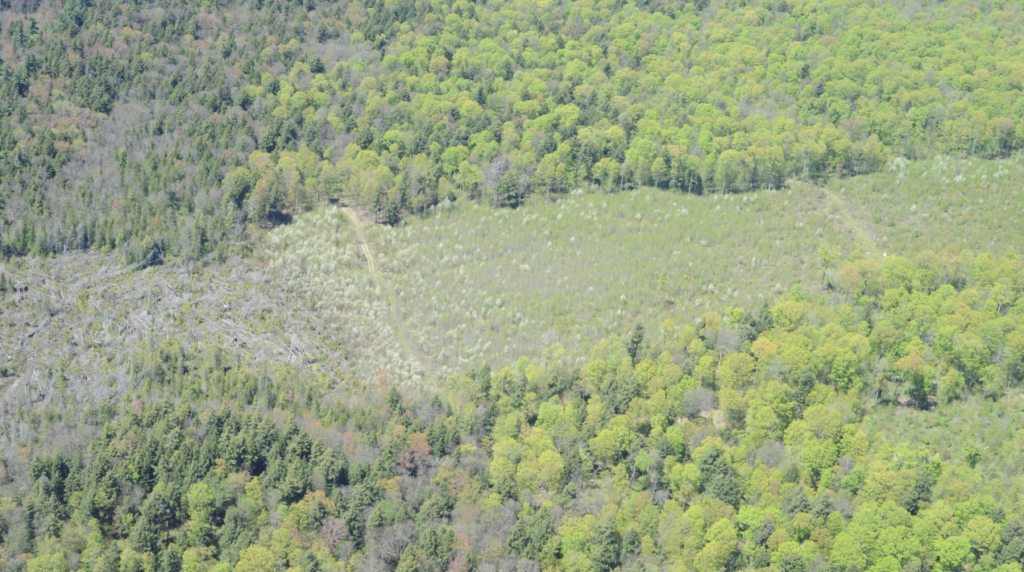
MTE was able salvage a significant amount of lumber — 14 million board feet of saw timber and 56,000 cords of pulp Brush
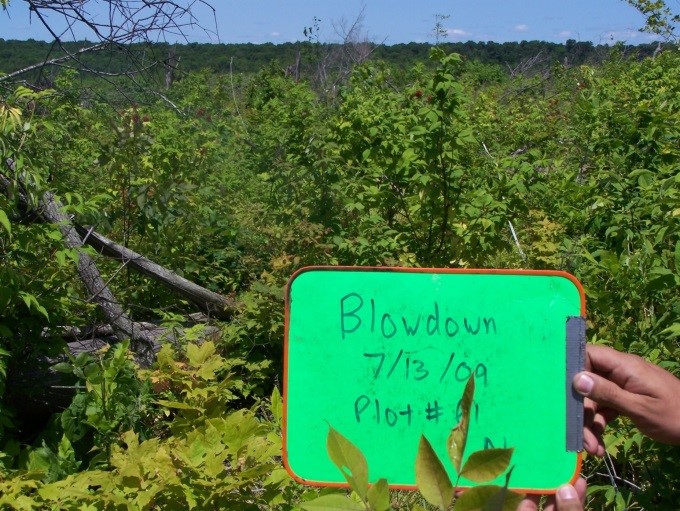
wood.  The long-term management of the forest in that area was greatly affected as the site was essentially reduced to a blank slate.  MTE meticulously manages its lands for a heathy and diverse forest on a long-term, sustainable basis. Practically every merchantable tree in the tornado’s path was gone. MTE’s foresters needed completely new plans on how to manage the young forest which would re-emerge. They waited several years to see what would occur naturally with the regenerating forest. They needed to understand both what was naturally regenerating and where it would be best to replant. However, 10 years after the salvage operation, the land is covered with thick brush, small densely packed trees, thorns, and significant down wood that was not merchantable during the salvage. These conditions made traditional field inventory difficult due to limited visibility and walking hazards from the thick cover and terrain.

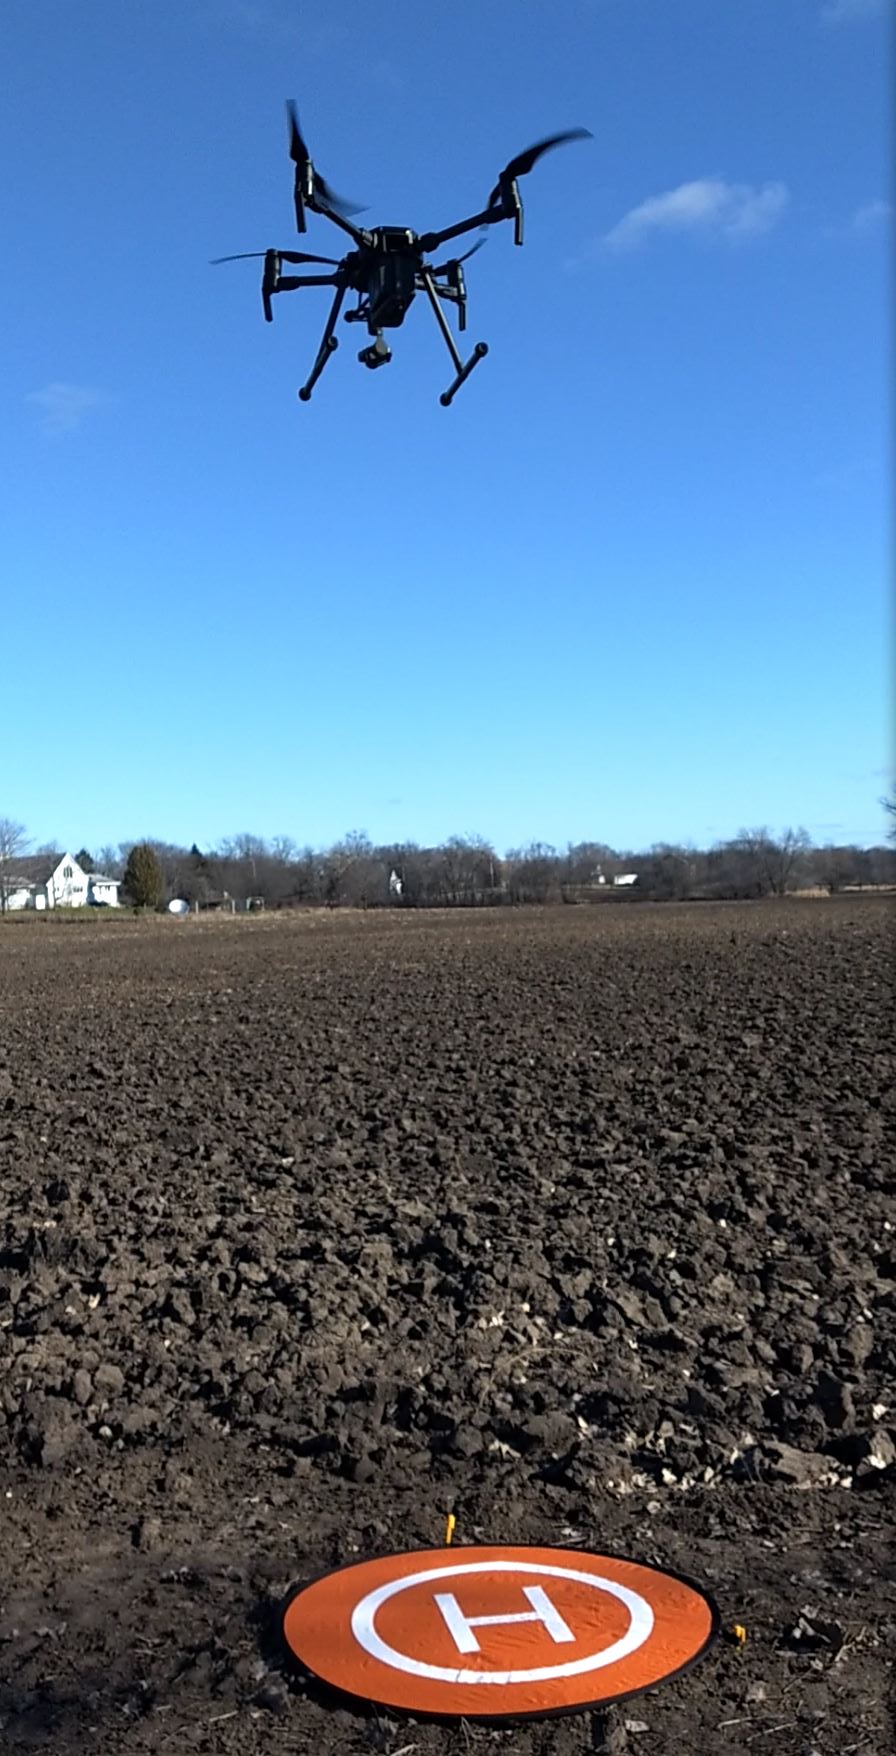
Having worked with Ayres Associates for similar projects, MTE asked Ayres if there was an aerial solution to economically estimate what was naturally regenerating at the site. Remote sensing, a practice of obtaining information without touching it, has long been used to monitor and assess the environment in remote or difficult locations. But this project site presented challenges to standard remote sensing methods.

The site contained young trees, with crowns still only a few feet in diameter, and natural clusters of species heavily mixed. Readily available satellite data such as LandSat, often used in wide-area remote sensing applications, would not work for this environment. Its 30-meter pixel resolution is simply too large to analyze single trees and small stands. Hyperspectral sensors can provide more granular data and provide 100s of bands of data for extremely detailed analysis, but their cost would’ve exceeded the project budget.

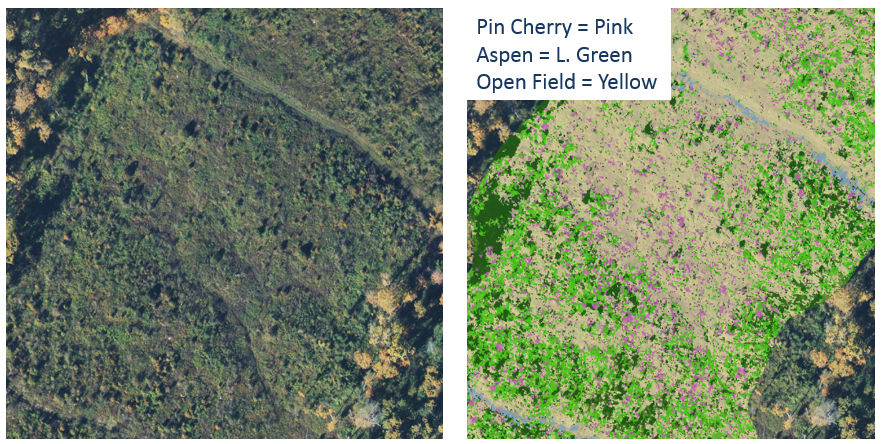
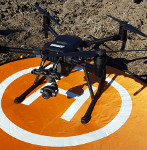
By narrowing the scope to only identify a few select classes of land cover, 4-band imagery, (red, green, blue, and Pin Cherry
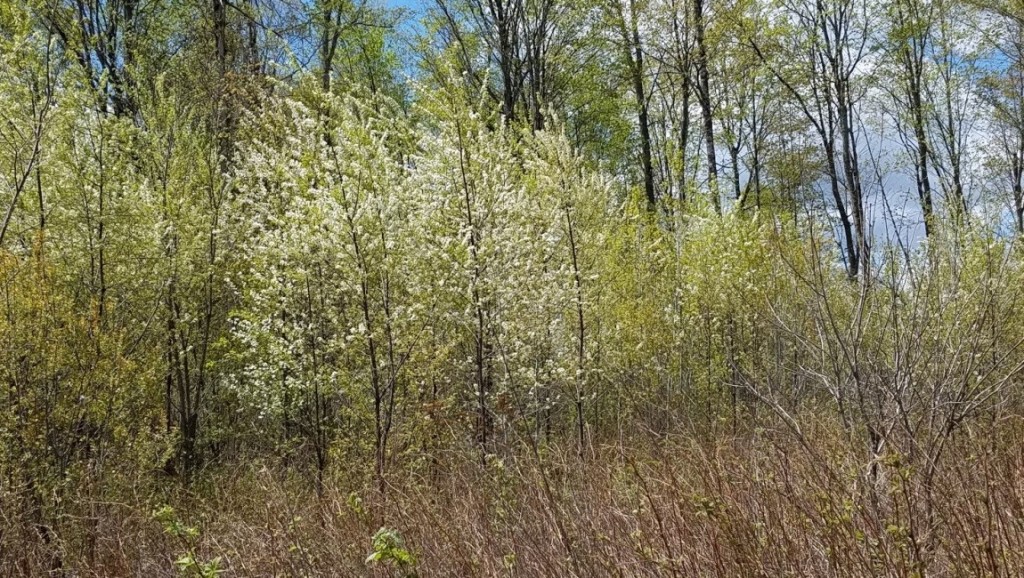
color infrared) could pinpoint key species at a much lower cost than hyperspectral data or a full field inventory. The key would be to collect two sets aerial imagery, each timed specifically to capture data when a specific species would have a unique spectral signature. Combined with an extensive set of sample data collected from the ground, the aerial data could be compared to identify types of vegetation. In this case, we targeted peak fall colors for aspen, and a mid-spring flight to capture pin cherries at their peak bloom.

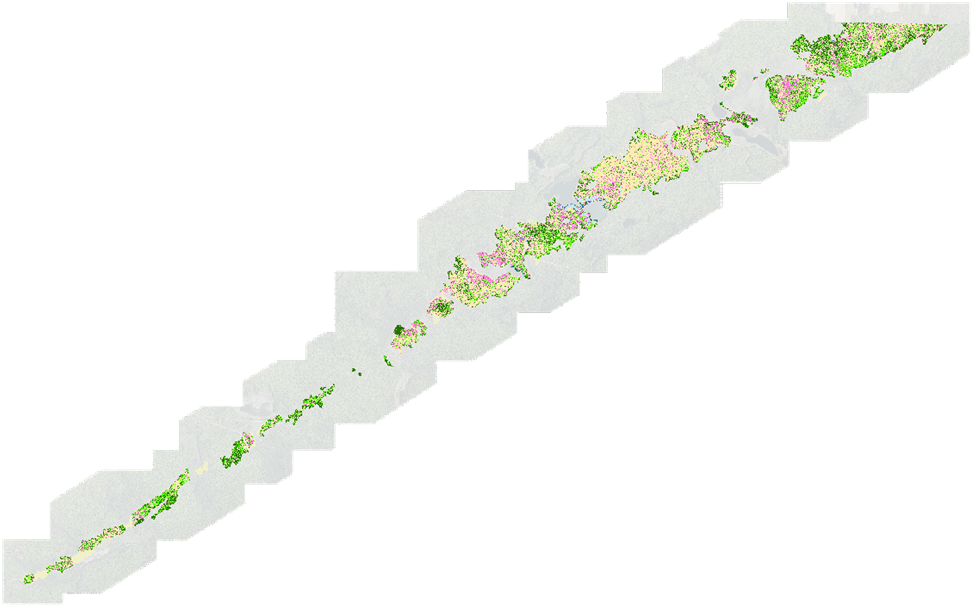
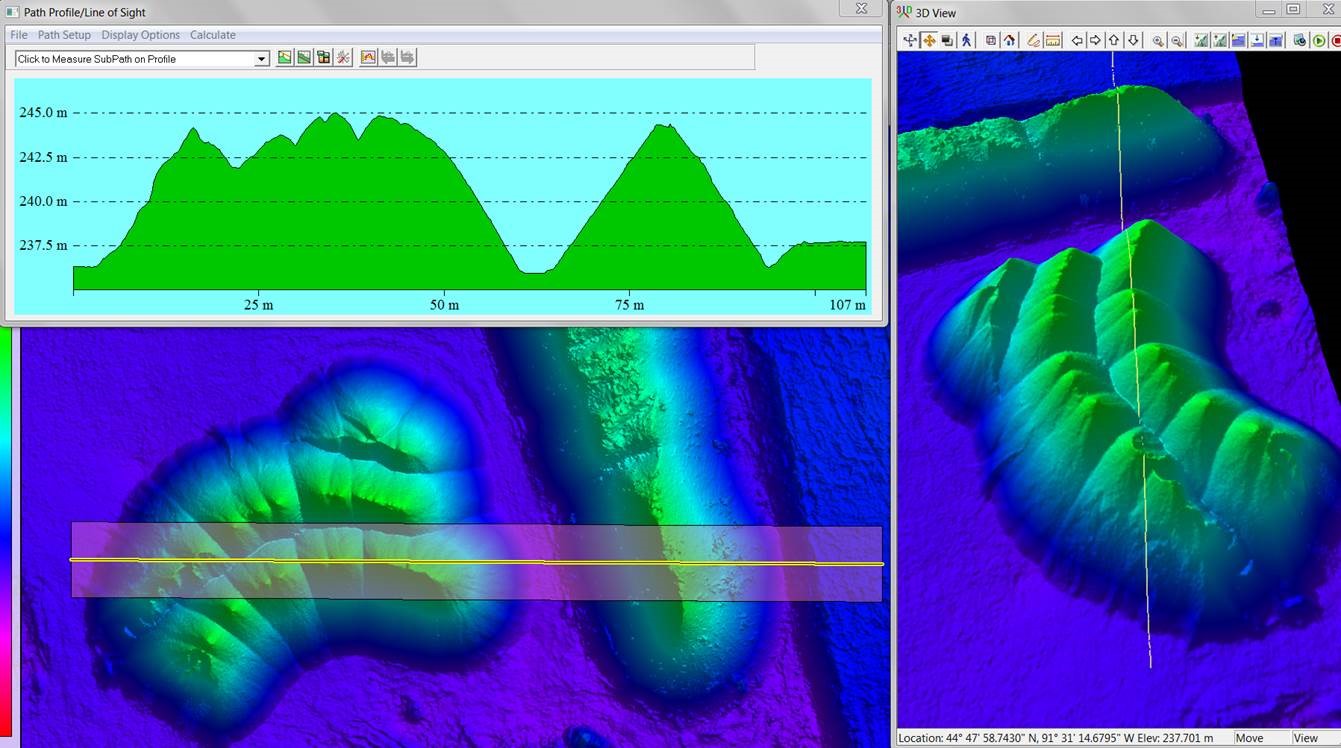
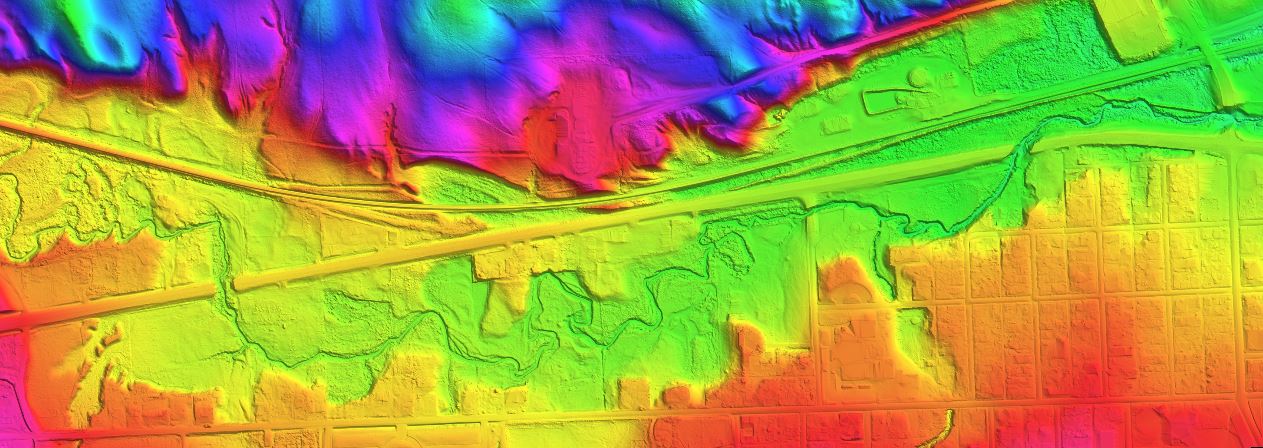
Ayres Associates, working in conjunction with our ecological partners at AES, analzed the data to map aspen, pin cherry, hardwoods, and dead wood, as well as open lands and water. After collecting the data,we began ourprocess by using segmentation techniques to examine each pixel in an image and compare it to adjacent pixels similar in spectral signature and shapes of groups. Our team then performed supervised classification on these groups of pixels using the sample sites from the field to classify the entire project area.

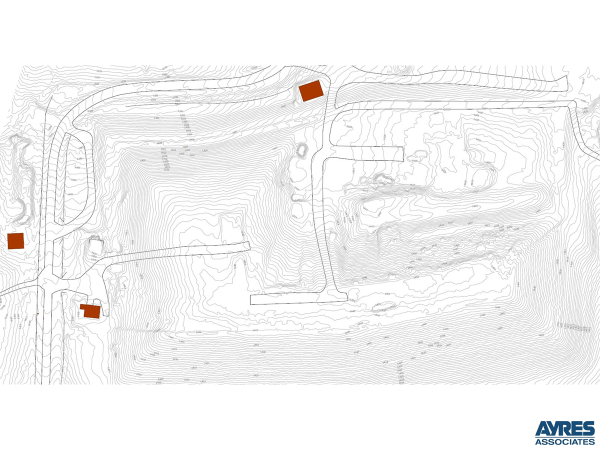
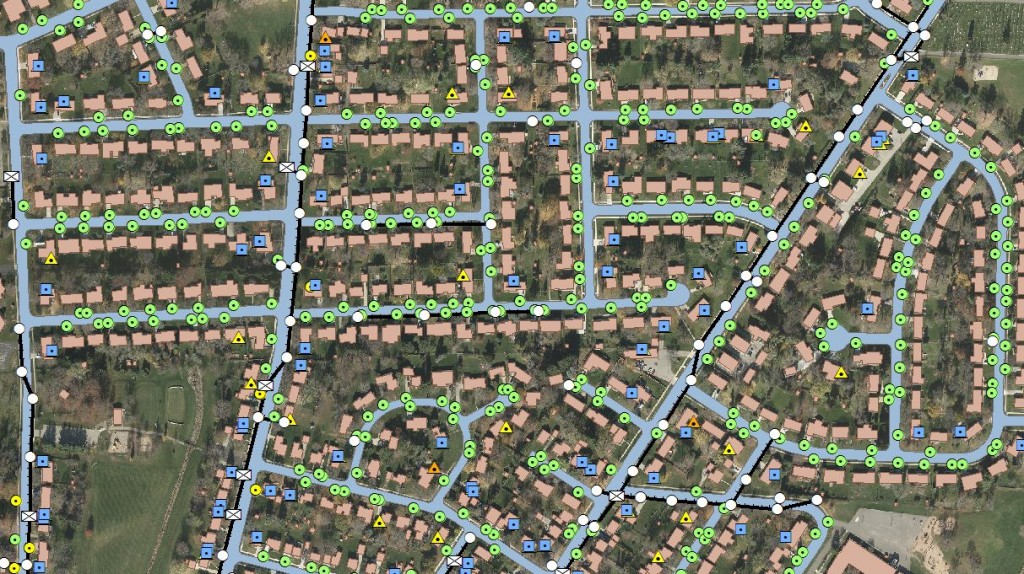
In these images you can see areas identified as pin cherry mixed with hardwoods as well as where areas of dead wood remain.Cherry_ID

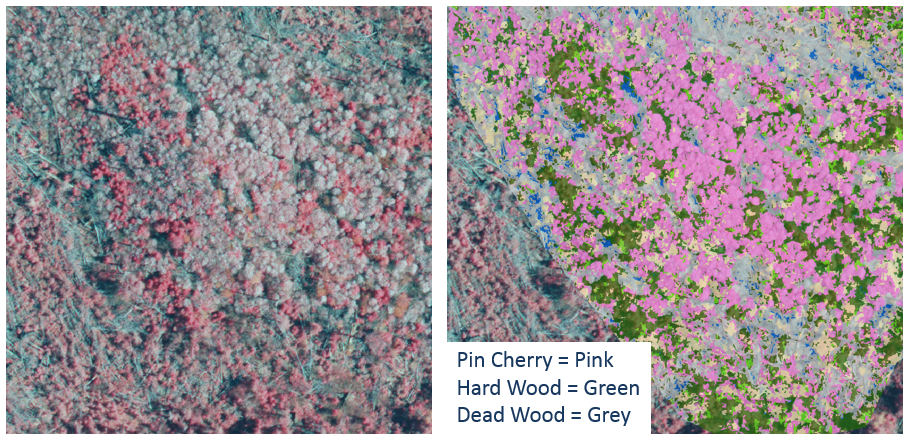
In these images you can see an area that has aspen starting to grow but is not regenerating as densely.

Aspen_ID

Remote sensing is not an exact science, and using 4 spectral bands versus the 100s a hyperspectral sensor would  produce does not generate as much data to analyze. However, by using multiple specifically timed data collections, trained professionals in photogrammetry and ecology can break data down into reliable categories. In this case, the estimated producer accuracies were over 90% and user accuracies over 80%. These rates are higher than MTE foresters felt they may have achieved with a field inventory in this difficult environment.

Using this data, the foresters expect significant savings of time, staff, and money. The data is already being used to identify areas with productive, manageable natural regeneration and areas where foresters will plan to start fresh and re-plant.

MTE’s primary mission is to provide for the Tribe while planning for and maintaining a sustainable forest. Over the course of several decades, they have aggressively pushed advanced management techniques to provide sustained timber yields. This is yet another example of MTE using innovative techniques to achieve that mission.

Site_Class

Feb 24

Land information gathering highlights best of Wisconsin


DSC_6702


This week, hundreds of land information professionals, GIS specialists, mapping experts, and others have come together for the 30th annual Wisconsin Land Information Association conference in Wisconsin Dells. The event, which Ayres Associates proudly sponsors at the platinum level, offers more than 50 educational sessions, technical workshops, and countless opportunities to network with our geospatial peers.

WLIA is a critically important grass-roots organization in Wisconsin, representing a diverse collection of professionals dedicated to developing, maintaining, and applying a network of statewide land information systems. For us at Ayres, the annual conference is an important event we wouldn’t miss and make a point to participate in at every level – speaking, moderating sessions, exhibiting, attending meetings, and, perhaps most critical of all, networking.

This year, six of our staff are presenting on timely aerial mapping-related topics: unmanned aerial systems, remote sensing, LiDAR, and point clouds.

EBEEB3E4
The presentation Jason Krueger and Jason Komorowski delivered Thursday on “Practical Applications for UAS for Engineering & Survey” examined how Ayres is using unmanned aerial systems or UAS for site and structural observation and for topographic mapping.


20170223_144510Later Thursday, Adam Derringer of Ayres, along with Joe Phillippi of Menominee Tribal Enterprises (MTE) delivered an informative 30-minute presentation on “Using Remote Sensing to Analyze 2007 Tornado Forest Reforestation.” Adam and Joe explained how a June 2007 tornado wiped out more than 2,200 acres of prime forest land and how MTE hired Ayres to use remote sensing to economically assess the forest’s regeneration – so that foresters could design a plan to ensure a positive financial result for future generations.


Later this morning, Zach Nienow of Ayres and Jason Poser of Buffalo County will deliver “LiDAR for Buffalo County – From Conception to Completion,” unveiling how a LiDAR journey that started in 2014 is coming to completion now, explaining how the project won support, how it was funded, and how data was acquired and processed. After their presentation, Jason Krueger and Jeff Koppensteiner will share “Point Clouds: Examining LiDAR and Photogrammetry as Tools,” diving into the intricacies of LiDAR-derived point clouds and point clouds extracted by dense image matching.


Despite the heavy snow descending upon us here today, we’re thrilled to be here with so many of our GIS peers and clients – interacting, learning, and networking. We’ll be posting highlights from our presentations and experience at this year’s WLIA conference next week. In the meantime, visit www.wlia.org/annual-conference/ to see more now.

#WLIA2017

#WLIA30YEARS

Feb 17

Ayres Attends Lidar Conference in Denver

group

A contingent from Ayres Associates attended the International LiDAR Mapping Forum (ILMF) in Denver February 13-15.

Jim Kelly, Jason Krueger, Adam Derringer, and Matt Vinopal


session
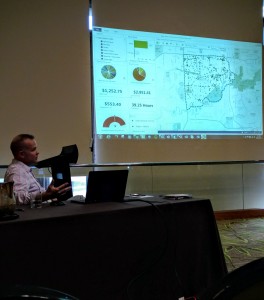
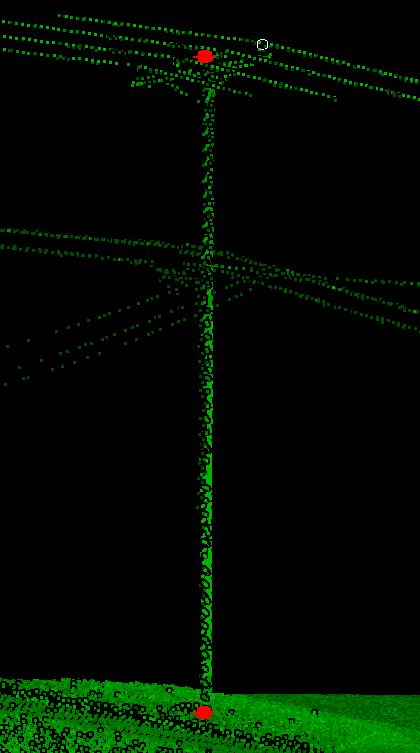
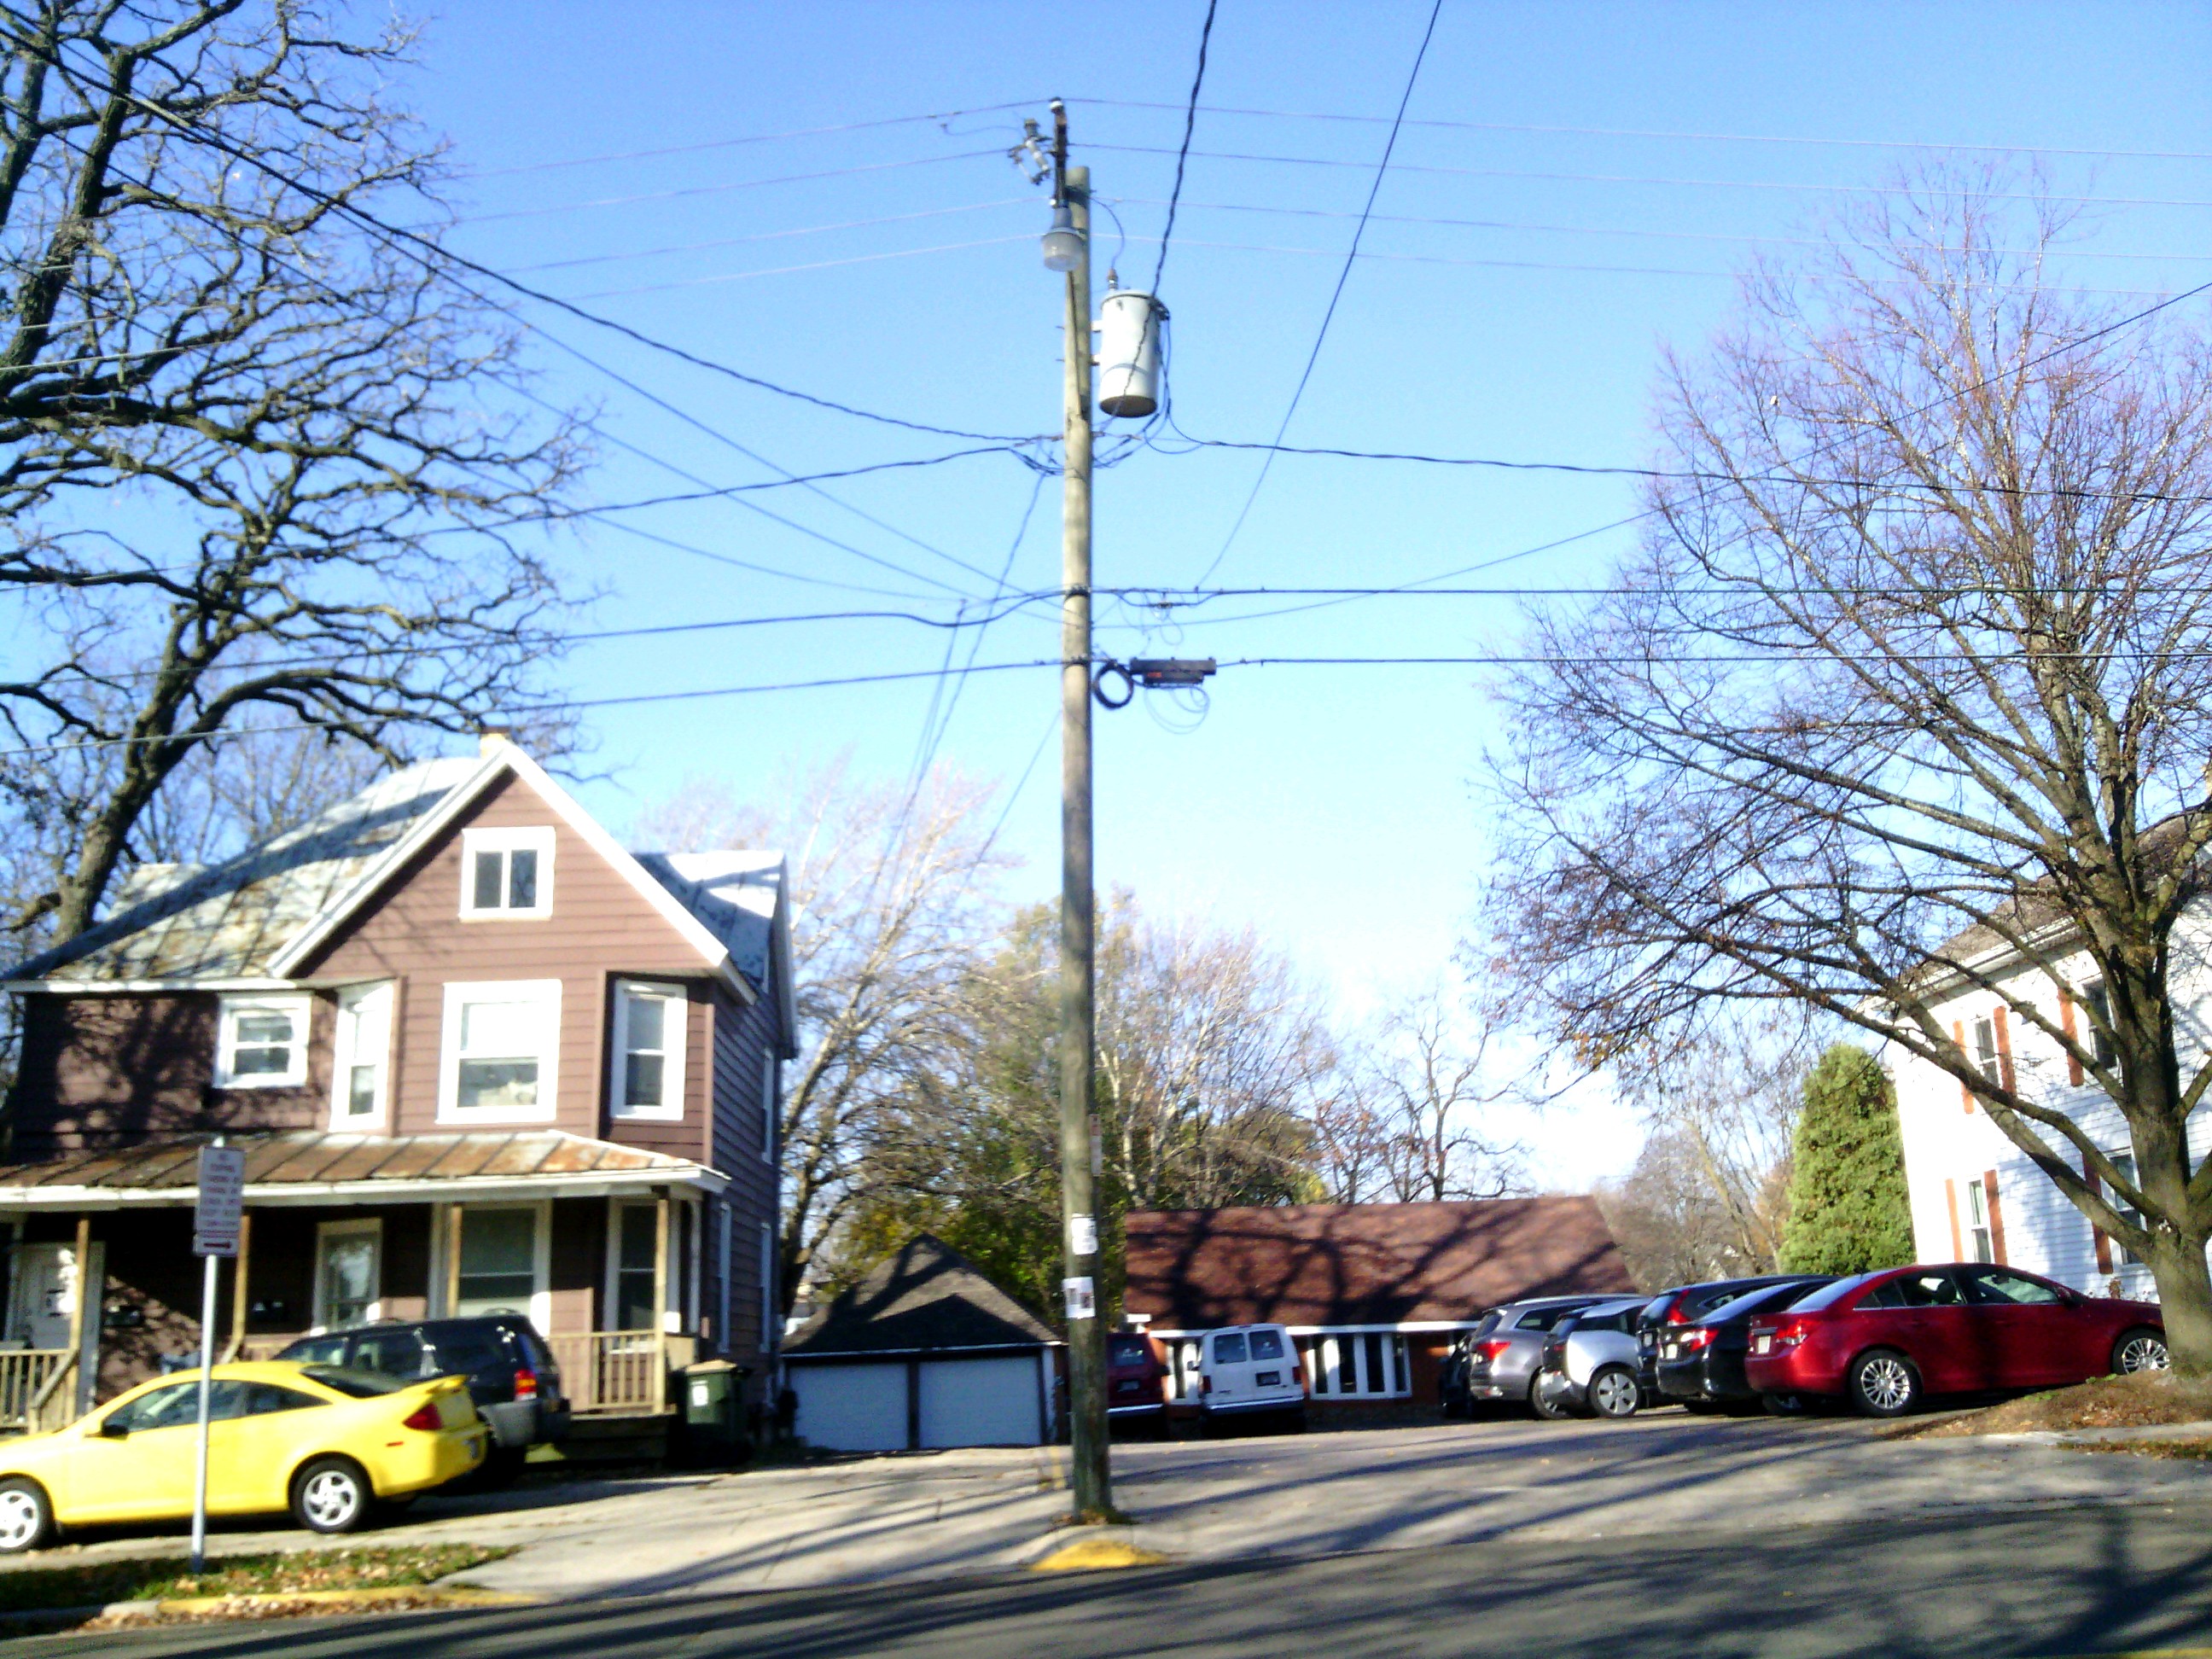
This technical conference is one of the most important national events that our Aerial Mapping group attends each year.  With a bustling exhibit hall and three days of technical presentations, the conference is packed with a full and diverse agenda focusing on aerial and ground-based Lidar applications and the latest news on sensor and software development. The event also provides a excellent venue for networking with other geospatial professionals, equipment and software vendors, and clients.


usgs2The Ayres crew invested much of their time in Denver participating in session topics related to the USGS 3DEP program.  Sessions within the USGS track included quality control methods, metadata, and future USGS initiatives to improve public access to Lidar data.  Much of what was learned during these tracks will have tremendous value as we wrap up the on-going 3DEP projects in Wisconsin and prepare for the next round in 2017.


presentationThe Ayres attendees also applauds the announcement that next year’s conference will be a joint effort between ASPRS and ILMF.  We believe that this will bring a broader audience and more holistic view of the geospatial landscape.  We are already eager for next year’s event and the opportunity to be a part of this important and exciting collaboration between these organizations.


Feb 10

Four Weeks of Fun: Ayres Completes City-wide Asset Management Project in Record Time

MobilLidarPole

Complex real world problems require multifaceted solutions, and Ayres Associates stepped to the plate and delivered during the 2016 holiday season. Under tight time constraints and adverse weather conditions, the staff from our Aerial Mapping and Land Survey groups combined forces to fulfill an important year-end delivery. The result was accurate data put into the capable hands of the client for making important and timely decisions to move a project forward.

Efforts began with mobile LiDAR data collection, GPS ground-based survey, and airborne acquisition of high-resolution aerial photography. The mobile LiDAR was collected over the course of a week in late November, while the GPS survey data collection began around the same time and continued throughout the Christmas season. The aerial imagery was acquired in late November just before the first snowfall. Processing of the spatial data began immediately upon completion, with the GPS survey data being tackled in chunks as it became available.

The mobile LiDAR data was brought into 3D point cloud processing software where skilled technicians extracted points of attachment on distribution poles. This was a big undertaking which resulted in the extraction of more than 10,000 such points throughout the dense suburban project area.

Using high accuracy GPS receivers and laser range-finding technology, the survey crews were able to obtain pole locations, pole attributes, pedestals, and georeferenced images. Survey crews also collected geospatial data of aerial attachments for final distribution. Like the mobile LiDAR, data collection and extraction were significant tasks with more than 11,000 such locations collected.

40000_img_0000_092338 t40000_img_0000_091909

Left: Image of Pole Collected by Surveyors in the Field
Right: Image of Accompanying Pole Tag Collected by Surveyors in the Field

The aerial imagery was used to create high resolution orthoimagery for base mapping and for 3D modeling of buildings, roads, pole tops and bottoms, and strand wires between poles. Nearly 15,000 building footprints were extracted from the stereo imagery and over 230 miles of pavement.

The final phase of the project was to bring this large amount of data into GIS in order to create a relational geodatabase…which was no small feat considering the number of data sources. Conglomerating data from multiple sources required a diverse approach involving synergizing everything under a common framework and sharing attributes among multiple themes. Text files from the GPS units were converted into spatial formats, 3D CAD files from the point cloud extraction were incorporated on a layer-by-layer basis, as were the 3D CAD files provided from stereo-compilation. Since the data was acquired from multiple different platforms, careful QC was essential to ensure the correct attributes were attached to the features they represented. This required diligent analysis and creation of a standardized processing methodology that was consistent and repeatable.

Map

Snipet from the Final Project Map 

In the end the final database was comprised of several layers of data, relational tables, and classes that define the relationships amongst them. All the data was delivered as 3D enabled layers, meaning the end user could visualize real-world scenarios, in addition to running traditional network analyses. The pole locations included hyperlinks to images of pole tops and tags. Additional attributes related to each pole contained the number of attachments and the height of each attachment above the ground surface.

All in all, this was a challenging and rewarding project for our team. Success relied on bringing together many of our specialties to produce an accurate deliverable on a tight schedule. Most importantly, the client obtained the geospatial data needed to make efficient business decisions to improve real world results.

Older posts «